GSEA many significant gene sets despite no differentially expressed genes
2
1
Entering edit mode
nhaus ▴ 10
@789c70a6
Last seen 16 hours ago
Switzerland

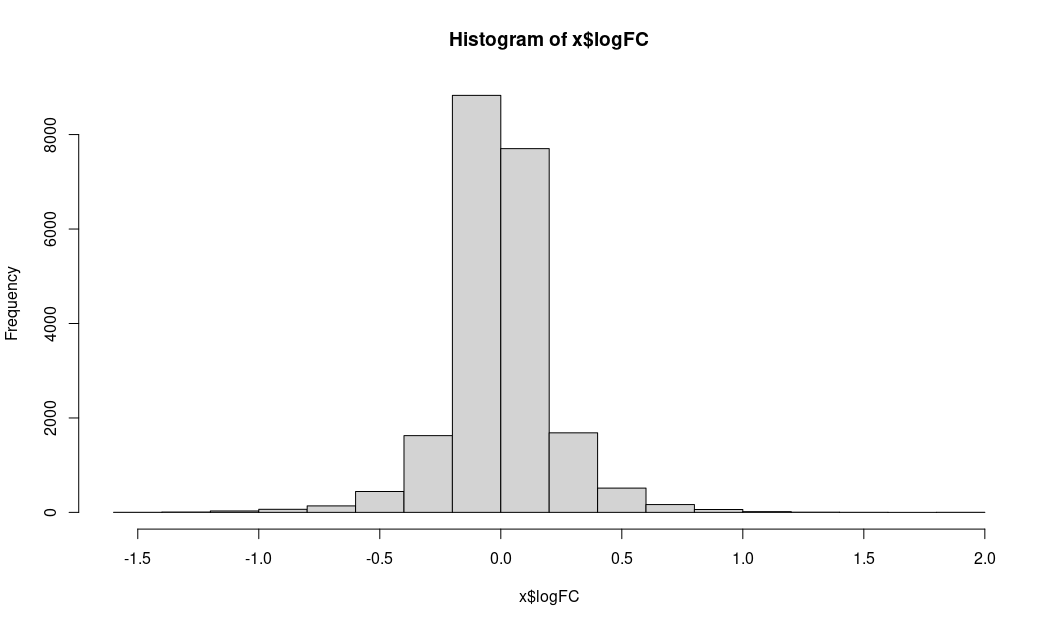
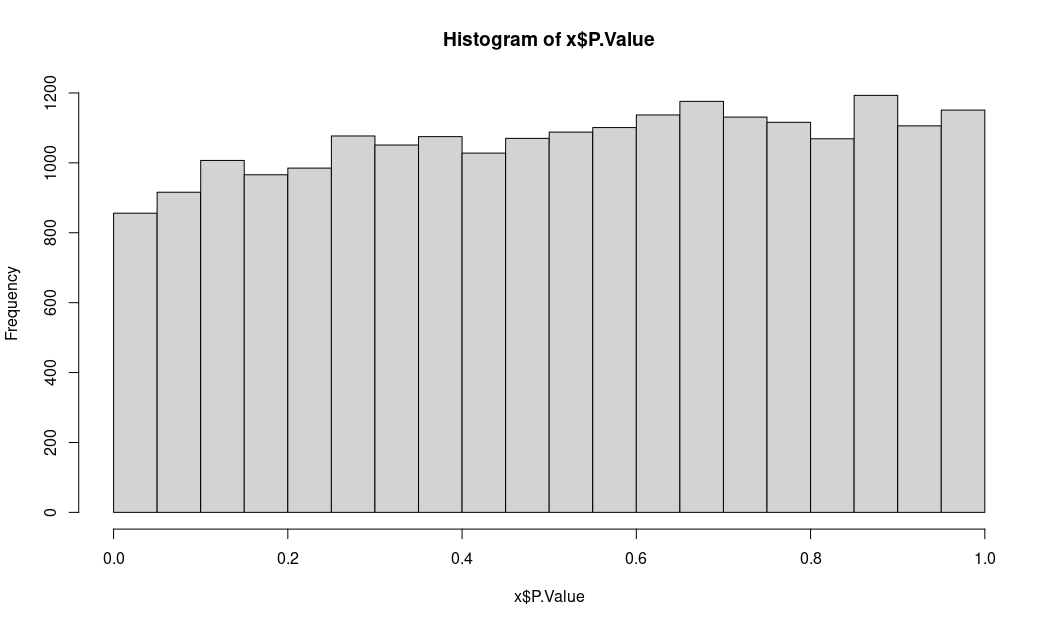
I am currently running a simple differential gene expression analysis to identify transcriptomic changes between two condition in ~60 patients. This analysis revealed no significantly differentially expressed genes. logFC are symmetrically distributed around 0 and range from -1.5 to 1.5. The adj.P.val ranges from 0.2 to 1 (vast majority is 1).

Nonethless, I decided to run clusterProfiler::GSEA (using hallmark gene sets from msigdb). For that I ranked the all genes according to the logFC that I got from running the differential gene expression analysis. To my surprise, there were plenty of significantly enriched terms (p.val<1e-16). I know this can happen and is also one of the "strengths" of GSEA, because it can detect changes at pathway-level, even if the changes in the expression level of individual genes are not significant, but I did not expect so many enriched pathways.

So I decided to run an additional test and ran differential gene expression analysis between a completely random subset of individuals (disregarding the two initial conditions). The logFC distribution and adj.P.val distribution looked similar to the "real" differential gene expression analsyis (comparing condition A and B). However, again GSEA showed many significantly enriched pathways. This makes me seriously doubt whether I can trust my GSEA results for "real" differential gene expression analysis.

I would greatly appreciate any insights you have on this topic and also maybe an explanation why this can happen and what I can do to prevent it.

EDIT:

Some more informations to illustrate the issue.

Because basically all adj. P values are one, the volcano plot is sort of meaning less. Instead I am showing the distribution of logFC and unadj.P.value

LogFC:

logFC

unadjusted P values:

pvalhist

This is how the top enriched pathway looks like. I used the clusterProfiler::GSEA function. topErnichedTerm

GSEA GeneSetEnrichment DifferentialExpression • 5.9k views
ADD COMMENT
0
Entering edit mode

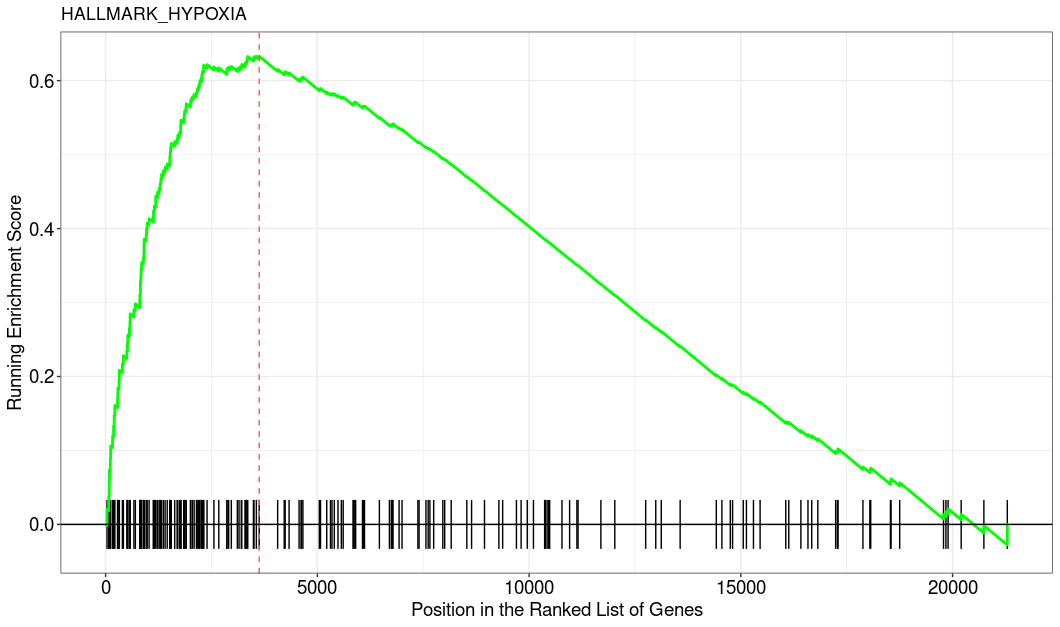
Which GSEA implementation did you use? I mean, GSEA-like analysis is fine to get some pointers but I would always couple it with inspection of the actual fold changes. After all GSEA is fully rank-based and if the individual logFCs that the ranking is based on are tiny then indeed this could indicate that results are statistically significant but biologically meaningless. Can you add some details and plots, e.g. MA-plot and the GSEA enrichment plot of a representative pathway?

ADD REPLY
0
Entering edit mode

Thank you very much for your reply! I have edited my original post.

ADD REPLY
0
Entering edit mode

Looks indeed as I was thinking, the rank-based analysis somehow got significant but the inspection of the actual fold changes clearly indicates that the ranks itself have little to no meaning (imo).

ADD REPLY
5
Entering edit mode
@gordon-smyth
Last seen 1 hour ago
WEHI, Melbourne, Australia

You are absolutely correct. You have nicely illustrated something that is known to some researchers in the gene set testing area but which is not generally appreciated in the bioinformatics community. The pre-ranked version of GSEA produces over-stated statistical significance. It will indeed produce highly significant pathway results even between randomly chosen groups of samples.

The pre-ranked version of GSEA has never been published or recommended by the GSEA authors themselves, presumably for that reason.

The problem is that pre-ranked GSEA treats genes as independent whereas genes in pathways tend to be positively correlated. Even small positive correlations can produce wildly inflated signficance, with true type I error rates around 40% instead of 5%, as we demonstrated here: https://doi.org/10.1093/nar/gks461. We didn't include pre-ranked GSEA in the simulation in our article, but it would have given the same bad results as the other methods that assume genewise independence.

I have been pointing out the problem with pre-ranked GSEA on this forum for nearly 10 years:

ADD COMMENT
0
Entering edit mode

Thank you very much for point me to all these great references, I have learned a lot! I have tried out cameraPR with an inter.gene.cor of 0.01, but have to say that I barely see a difference to the GSEA that I have run before (preranked and ignoring gene correlation).

Do I understand the documentation correctly, that the statistic of cameraPR(statistic, index, use.ranks = FALSE, inter.gene.cor=0.01, sort = TRUE, ...) should already be sorted in decending order (for example using logFC or t.statistic).

I concluded that from this line _Competitive gene set test allowing for correlation between genes: pre-ranked statistic._ from the cameraPR source code (https://rdrr.io/bioc/limma/src/R/geneset-cameraPR.R)

Thank you again for your time!

ADD REPLY
2
Entering edit mode

Preranked GSEA is analogous to cameraPR with inter..gene.cor = 0. inter.gene.cor = 0.01 will give different results, especially for larger gene sets. Nevertheless, cameraPR does not give the rigorous error rate control that is achieved by the original camera function.

Results from cameraPR are sorted by default. You can see that be reading the documentation (?camera) for the sort argument.

ADD REPLY
0
Entering edit mode

Im sorry, I think I was not clear. I just wanted to ask you if my understand is correct, that the input gene list of cameraPR should already be sorted in descending order.

ADD REPLY
1
Entering edit mode

Sorry, I misread.

No, there is no need for statistic to be sorted. Normally genes are left the original order, same as for lmFit. Type example(cameraPR) and you will see everything is just left in the original order.

The reference to "pre-ranked" in the name of the function does not imply any sorting but is just to mimic the GSEA terminology.

ADD REPLY
0
Entering edit mode

Thank you very much for clarifying!

I have a follow up question. In your example the files are left in the same order as lmFit and the order of lmFit is basically determined by the counts matrix of my DGElist, which to some extend (at least for my understanding) is random. However, if I manually shuffle my t.statistic before passing it to cameraPR I get completely different result (cameraPR(sample(fit$t[,2]), list(set1=index1,set2=index2))). Can you quickly elaborate why that is the case?

Thanks again for your time!

ADD REPLY
0
Entering edit mode

Read the doc please. How do you think the function figures out which statistic value corresponds to which gene in each set?

ADD REPLY
0
Entering edit mode
@james-w-macdonald-5106
Last seen 6 hours ago
United States

There is no assumption that any of the genes are significant in a univariate analysis. The test is one of ranking, where groups of genes with higher than expected ranks (under the null) are considered significant. As you can see in your plot, the hypoxia genes are 'piled up' at the top of the ranked list of genes, when the expectation would be a more uniform distribution across the ranks.

ADD COMMENT
0
Entering edit mode

So, the input for the GSEA should be all the genes from DEA? Both significant and not significant genes?

ADD REPLY
0
Entering edit mode

Yes, that is the whole point of the method. Please in general ask general bioinformatics question at biostars.org and not in existing threads.

ADD REPLY

Login before adding your answer.

Traffic: 646 users visited in the last hour
Help About
FAQ
Access RSS
API
Stats

Use of this site constitutes acceptance of our User Agreement and Privacy Policy.

Powered by the version 2.3.6