Entering edit mode

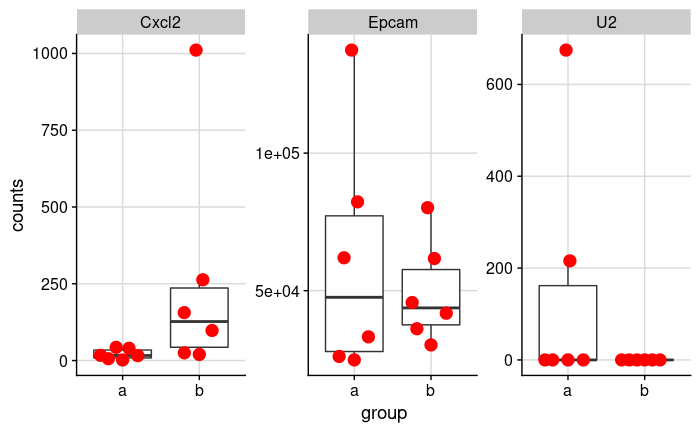
Let's look at the expression data of three genes in two groups.
This is a subset of a real dataset comparing unpaired treated and untreated mouse colon organoids.
By looking at it, it seems like there's a clear difference in Cxcl2, there is likely no difference in Epcam, and there's clearly no
difference in U2 (ok, there are two outliers).
df = data.frame(
  group=rep(c("a", "b", "c"), 6),
  U2=c(0, 0, 0, 0, 0, 452.939, 0, 0, 0, 215.705, 0, 427.984, 0, 0, 1411.686, 674.763, 0, 0),
  Cxcl2=c(6, 25, 6, 17, 20, 4, 2, 156, 6, 40, 1010.999, 35, 43, 98, 57, 16, 263, 54),
  Epcam=c(24818, 30270, 24818, 26090, 41797, 42059, 33214, 36154, 40872, 137463, 45677, 80316, 61955, 61683, 82049, 82288, 80172, 67598)
) |> dplyr::filter(group != "c")
If I use a generalized linear model with negative binomial famliy as a baseline, the statistics exactly reflect my gut feeling:
summary(glm(Cxcl2 ~ group, family = MASS::negative.binomial(2), data=df))$coefficients["groupb", "Pr(>|t|)"]
summary(glm(Epcam ~ group, family = MASS::negative.binomial(2), data=df))$coefficients["groupb", "Pr(>|t|)"]
summary(glm(U2 ~ group, family = MASS::negative.binomial(2), data=df))$coefficients["groupb", "Pr(>|t|)"]
[1] 0.004115246
[1] 0.5350445
[1] 0.9946097
However, when running DESeq2, suddenly U2 is by far the most significant gene (padj = 3.3e-17 !!):
dds = DESeqDataSetFromMatrix(
  df |> select(-group) |> t() |> round(),
  colData = df |> select(group),
  design = ~group
)
dds = DESeq(dds)
results(dds)
log2 fold change (MLE): group b vs a
Wald test p-value: group b vs a
DataFrame with 3 rows and 6 columns
        baseMean log2FoldChange     lfcSE      stat      pvalue        padj
       <numeric>      <numeric> <numeric> <numeric>   <numeric>   <numeric>
U2       77.4418      -25.71397  3.004014  -8.55987 1.12996e-17 3.38987e-17
Cxcl2    53.3127        1.73778  0.489112   3.55294 3.80956e-04 5.71434e-04
Epcam 62107.1289       -1.46626  0.453298  -3.23465 1.21790e-03 1.21790e-03
I don't understand that. Anything I'm doing wrong? If not, why does DESeq behave the way it does?

Yes, also copying over my comments from where this was asked on twitter:
The problem is attempting to compare LFC/SE across genes when one is at the boundary of the parameter space. This breaks down as p-values don’t measure interestingness. I'd recommend to try LRT instead here (deals better with cases where you are at boundary of parameter space) and use shrunken LFC for effect size ranking.