
Hello, I am analysing data comparing transcriptomics of exosomes to cells and I am not sure if these results looks normal
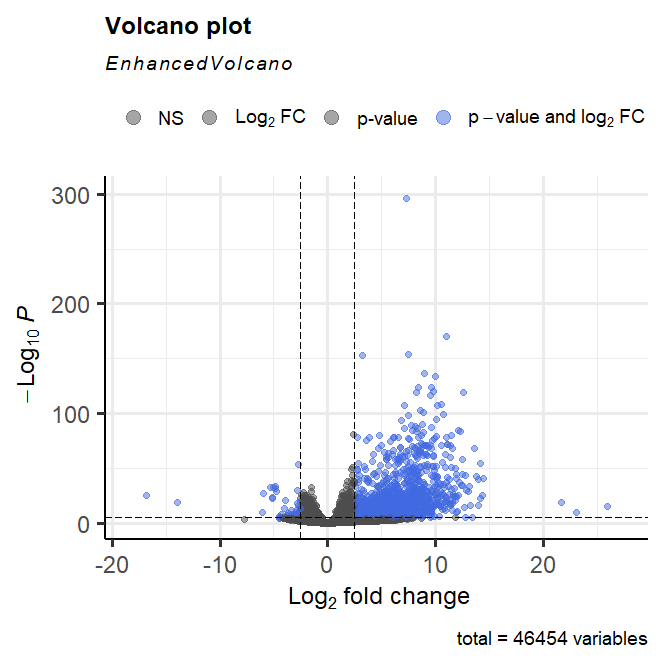
I identified a lot more upregulated genes in exosomes than in cells (see volcano plots below). I think this is unusual for 2 reasons. one, I am not certain but I thought I should expect similar up and down regulated genes on a volcano plots, but this is very skewed. Two, exosome are a lot smaller than cells and is expected to contain less mRNA species than cells, but the result suggests that there are thousands of gene that are upregulated inside exosomes (I have double checked that my contrast was in the right order). One possible explanation is that the fewer mRNA species are enriched because they are actively selected and packaged into exosomes. Does this sound reasonable?
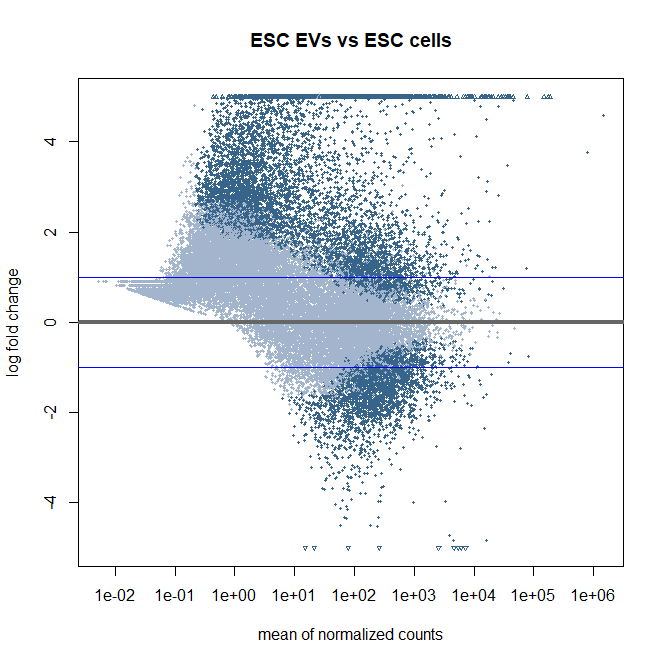
Here is the MA plot from the same dataset used for volcano plots. with ashr shrinkage (I need to use contrast, so I select this method for shrinkage) I wonder if this MA plots looks okay. They are slightly off center. If this is unusal what should I do to improve the normalisation? I tried removing more genes with low count but it did not help much. Other QC plots like bar plot, PCA, sample heatmaps and histogram looks fine.
Is the okay to proceed the downstream analysis of the DEGs if this is the MA plots/ volcano plots?

After identifying a set of house keeping genes to normalise to, how do I proceed from there on DESeq2? Could you please suggest some pipelines or reading of how this can be done practically? I am just following the basic DESeq2 here and is not sure how to do a selective normalisation. No spike-ins were used.
I do not know for sure if expression of the house keeping genes would be the same inside exosomes and cells, but since there is an active sorting system that package specific mRNAs into exosomes I suspect it will not be the same proportion. Do you think with the current MA plots, the identified DEGs can still be used for downstream analysis or do I really need to correct the normalisation somehow?
Housekeeper is just a buzzword I used here. What genes exactly you use depends on the biology of these exosomes and whether you can even confidently define genes that are suitable here. GIven that, as you say, this is an active process, I wonder whether spike-ins would not have been valuable here. Anyway, for the technical part: https://bioconductor.org/packages/release/bioc/vignettes/DESeq2/inst/doc/DESeq2.html#control-features-for-estimating-size-factors