limma plotMDS - logFC inverted?
2
0
Entering edit mode
Katharina • 0
@c1cc8b34
Last seen 10 months ago
Berlin

Hello everyone,

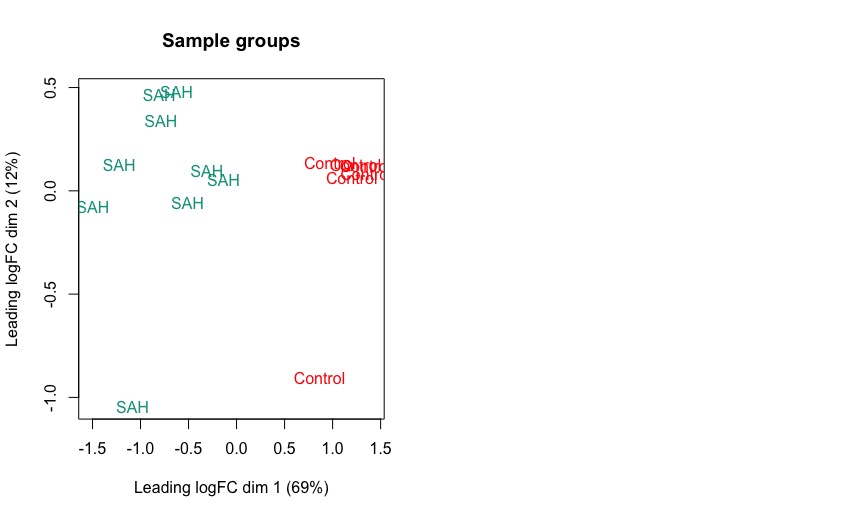
I am struggling with the interpretation of a MDS plot. In my study, I am comparing 84 genes of two different groups (control vs SAH). The exploratory MDS plot groups the SAH condition to the left (negative) on the x axis (leading logFC dim 1) and the control group to the right (positive values). How can I interpret this? I double checked my raw data and it rather looks as if the SAH group tends to have higher log fold changes in many gene compared to the control group (and not smaller logFC as in dim 1 of the graph). The plotMDS function details say that

Distances on the plot can be interpreted as leading log2-fold-change, meaning the typical (root-mean-square) log2-fold-change between the samples for the genes that distinguish those samples.

# Unsupervised clustering of samples
library(wesanderson)
lcpm <- cpm(dge, log=TRUE)
par(mfrow=c(1,2))
col.group <- group
col.group <- as.factor(col.group)
levels(col.group) <- wes_palette(nlevels(col.group), name="Darjeeling1")
col.group <- as.character(col.group)
plotMDS(lcpm, top = 500, labels=group, col=col.group)
title(main="Sample groups")

sessionInfo( )
R version 4.2.1 (2022-06-23)

plotMDS graph including all genes

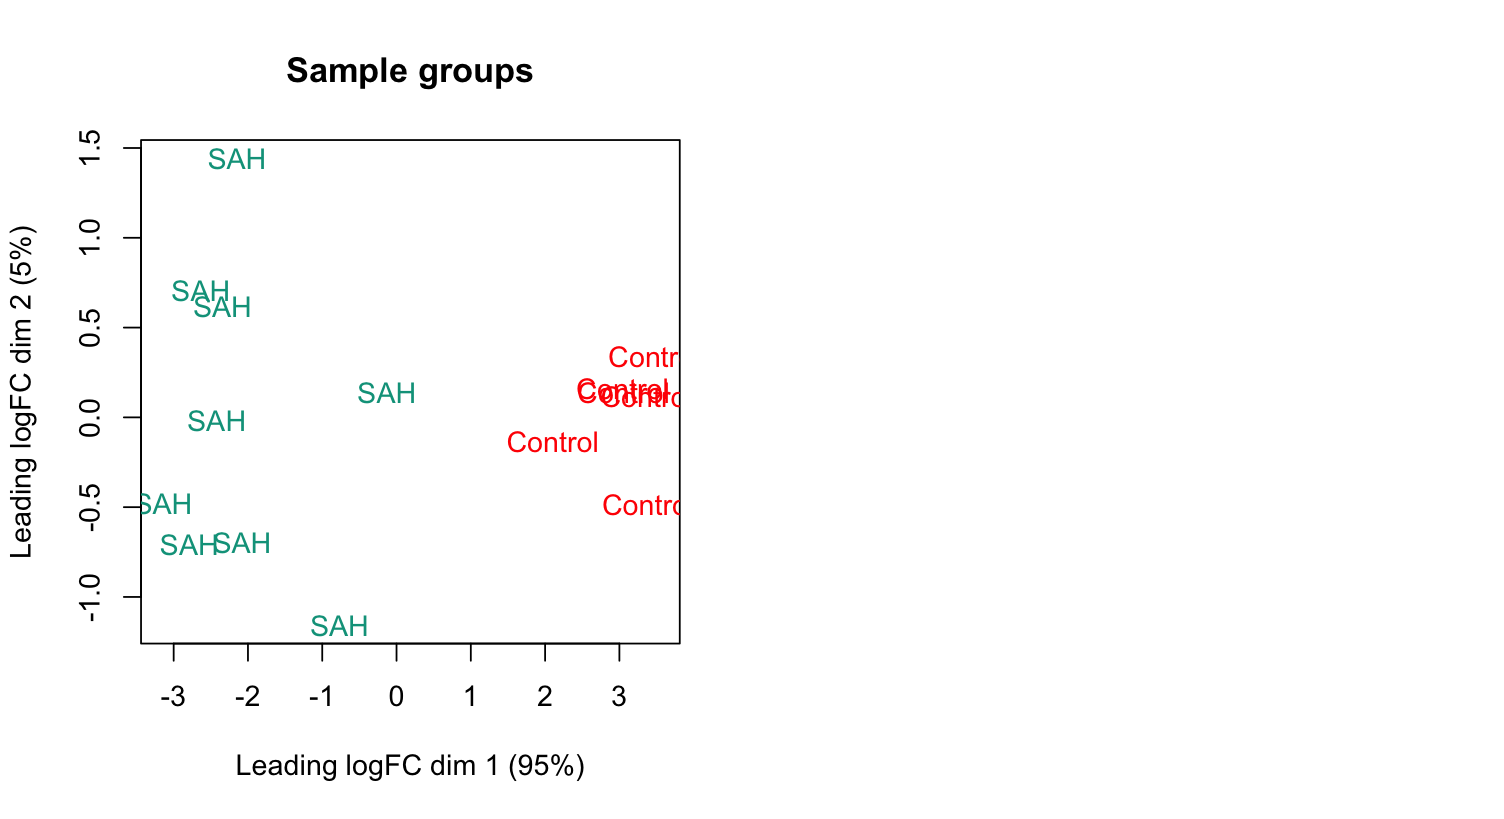
To check this in further detail, I extracted two single differentially expressed genes which are in fact higher expressed in the SAH condition and compared it to the control condition, repeating plotMDS.

sq3=

Values of extracted genes

> par(mfrow=c(1,2))
> col.group <- group
> col.group <- as.factor(col.group)
> levels(col.group) <- wes_palette(nlevels(col.group), name="Darjeeling1")
> col.group <- as.character(col.group)
> plotMDS(sq3, top = 2, labels=group, col=col.group)
> title(main="Sample groups")

Still, logFC dim1 of SAH shows smaller values than the controls.

enter image description here

What am I overlooking (about the code or the calculation behind the plot)?

Thank you so much for your help!

limma MultidimensionalScaling • 1.5k views
ADD COMMENT
2
Entering edit mode
@gordon-smyth
Last seen 12 hours ago
WEHI, Melbourne, Australia

The MDS plot shows the average absolute size of the leading log2-fold-changes, but not the direction of change. Different genes change in different directions, so it would be impossible for the MDS plot to show the direction of change. The +/- sign of the axes in the MDS plot doesn't have any meaning. The plot would have exactly the same interpretation even it was flipped left to right or top to bottom.

The two MDS plots agree with your data. The first plot when you include all genes shows that the typical logFC between SAH and control is about 4-fold (equal to 2 on the log2 scale). The second plot with just two genes shows a typical logFC of about 6 on the log2 scale, which agrees with your data perfectly.

ADD COMMENT
0
Entering edit mode

This helped me a lot! Thank you so much.

ADD REPLY
2
Entering edit mode
@james-w-macdonald-5106
Last seen 6 hours ago
United States

The dimensions are the root-mean-square average of the top differences between samples, which is not the same as the difference between samples for two genes. You are comparing data for two genes (your table) to the average over 500 genes (the plot). It shouldn't be surprising that they are different.

Anyway, the MDS plot isn't really something you need to interpret this way. It's more useful to check for unexpected results (e.g., samples that are grouping unexpectedly which may indicate batch issues, or sample swaps, etc) rather than as a tool to infer fold changes between samples.

ADD COMMENT
0
Entering edit mode

Thank you a lot for the fast reply. I was not wondering why the two plots look differently because I intentionally included only two genes for the second plot as a test. I was rather wondering why the displayed fold-changes (especially in the second plot) are lower in the SAH group compared to the control group, given the table of count (log) values above.

Given the leading log FC dimension annotation in the plot, I thought it would be useful to comprehend what this annotation really means instead of just looking for batch issues.

ADD REPLY

Login before adding your answer.

Traffic: 615 users visited in the last hour
Help About
FAQ
Access RSS
API
Stats

Use of this site constitutes acceptance of our User Agreement and Privacy Policy.

Powered by the version 2.3.6