ComplexHeatmap - z-score color coding failed
2
0
Entering edit mode
Katharina • 0
@c1cc8b34
Last seen 10 months ago
Berlin

Hello everybody,

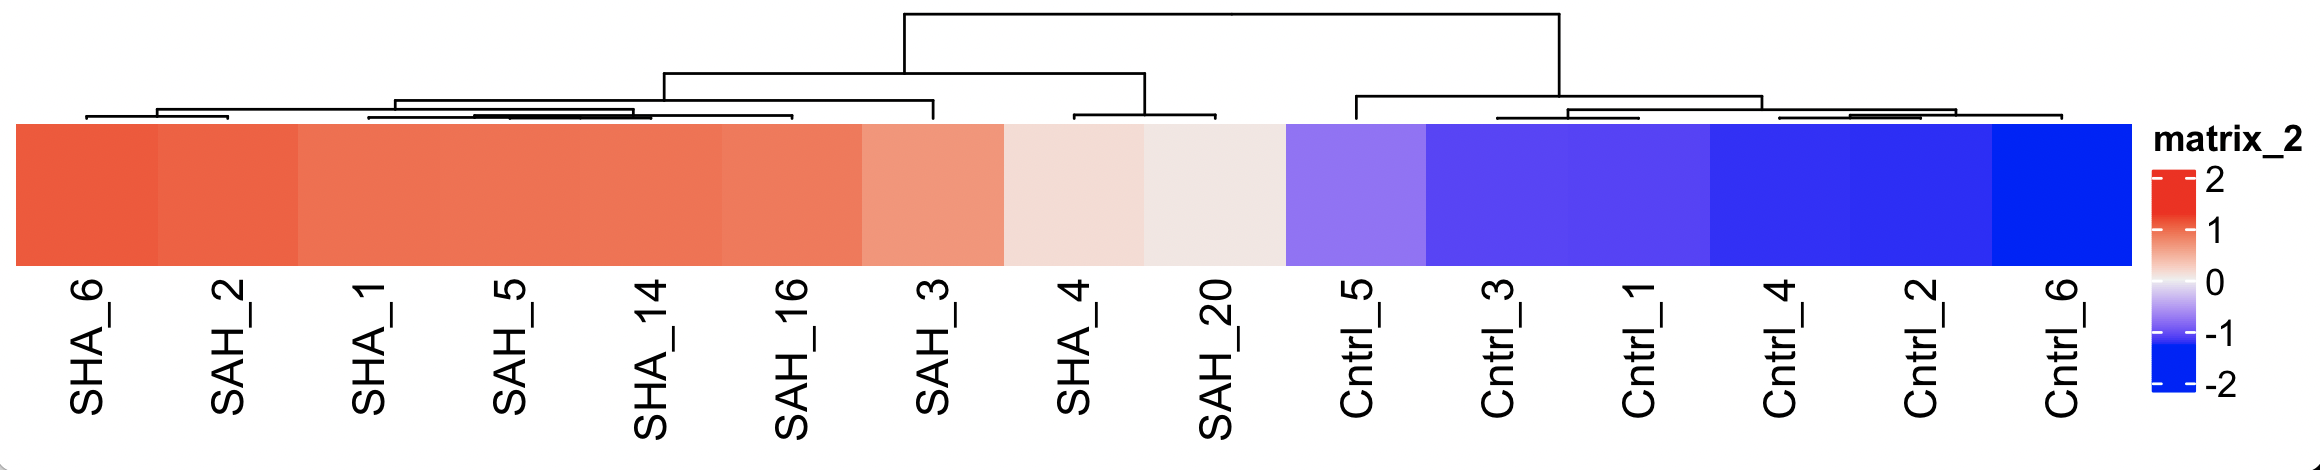
I created a simple and a complex heatmap comparing gene expressions in two groups (control vs SAH) and noticed that the z-score color coding of the complex heatmap does not seem to fit the z-scores.

I picked one special molecule in the heatmap to display the differences in the simple and the complex heatmaps. Here you can find the log fold change values:

enter image description here

And the corresponding z-scores:

lcpm.df.scaled <- t(apply(lcpm.df, 1, scale))

enter image description here

Simple heatmap:

library(gplots)
Control.vs.SAH.topgenes <- Control.vs.SAH$ENTREZID[1:100]
i <- which(v$genes$ENTREZID %in% Control.vs.SAH.topgenes)
mycol <- colorpanel(1000,"blue","white","red")
heatmap.2(lcpm[i,], scale="row",
          labRow=v$genes$SYMBOL[i], labCol=group, 
          col=mycol, trace="none", density.info="none", 
          margin=c(8,6), lhei=c(2,10), dendrogram="column")
sessionInfo(R version 4.2.1 (2022-06-23))

enter image description here

This color-coding makes sense for me.

The problem: It seems as if something went wrong with the z-score color coding in the complex heatmap.

Complex Heatmap:

ha <- HeatmapAnnotation(summary = anno_summary(gp = gpar(fill=2),
                                               height = unit(2, "cm")))
h1 <- Heatmap(lcpm.df.scaled[rows_keep,], cluster_rows = F,
              column_labels = colnames(lcpm.df.scaled), name = "Z-Score",
              cluster_columns = T)
h2 <- Heatmap(l2_val, row_labels = df.top$SYMBOL[rows_keep],
              cluster_rows = F, name = "logFC", top_annotation = ha, col = col_logFC,
              cell_fun = function (j, i, x, y, w, h, col)
                grid.text(round(l2_val[i, j], 2), x, y))
h3 <- Heatmap(mean, row_labels = df.top$SYMBOL[rows_keep],
              cluster_rows = F, name = "AveExpr", col=col_AveExpr,
              cell_fun = function (j, i, x, y, w, h, col)
                grid.text(round(mean[i,j],2), x, y))
h <- h1+h2+h3

h

On the left you can see the z-score color coding, followed by the log-FC(6.98) and on the right you can see the AveExpr (12.55).

enter image description here

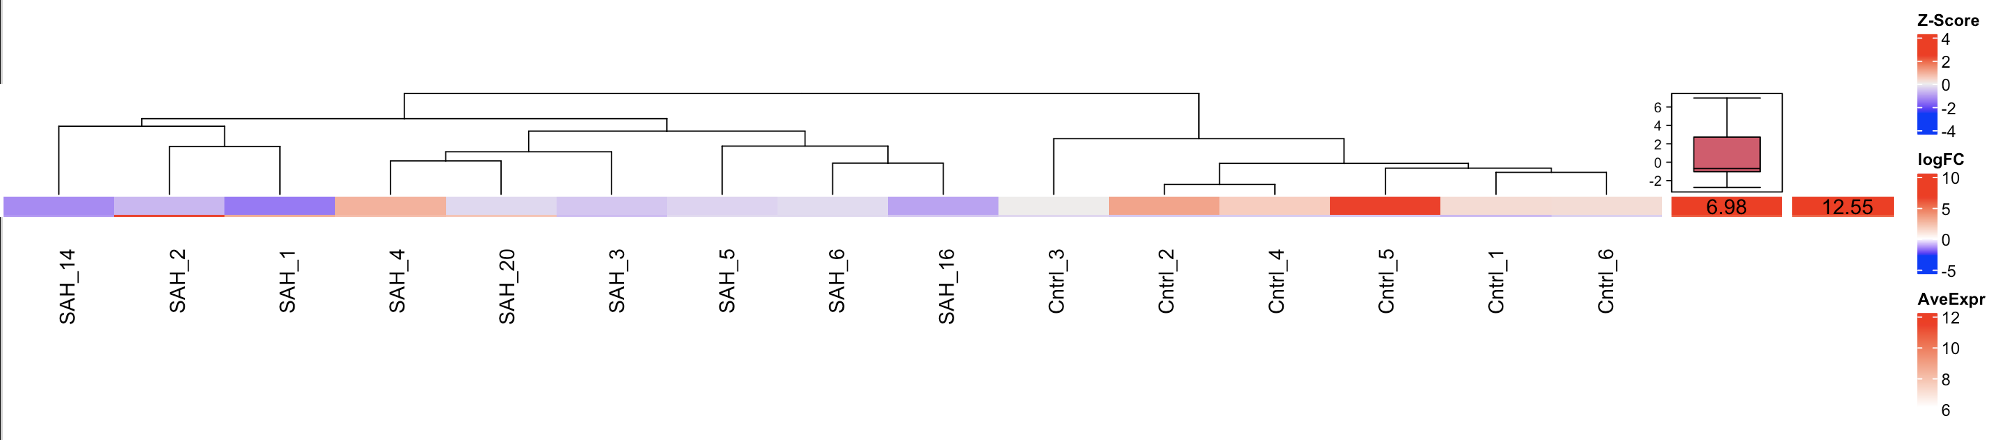
Do you have any idea why the complex heatmap does not really fit the z-scores?

Thank you a lot for your help.

heatmaps ComplexHeatmap • 1.5k views
ADD COMMENT
2
Entering edit mode
Zuguang Gu ▴ 260
@zuguang-gu-7797
Last seen 8 days ago
Germany / Heidelberg / DKFZ

Have you checked the matrix lcpm[i,] for heatmap.2() and lcpm.df.scaled[rows_keep,] for Heatmap() are the same?

Also heatmap.2() requires the matrix having rnow > 1 and ncol > 1. I guess lcpm[i,] should have at least two rows?

The following plot is based on the data you provided:

enter image description here

ADD COMMENT
0
Entering edit mode

Thank you so much! I added the first 25 genes in a decreasing logFC ranking as h2 on the right side and the corresponding average expressions as h3. It turned out that the z-scores of the actual heatmap h1 were not ranked so that the wrong molecules were matched.

ADD REPLY
0
Entering edit mode
@james-w-macdonald-5106
Last seen 1 hour ago
United States

When posting what you might think is a bug, it's important to provide a self-contained example that others can use to replicate your results. Your code is not complete, we don't have access to the data, and it's not clear that you are using the data you say you are using.

Put another way, the heatmap using ComplexHeatmap has as the highest value the Cntrl_5 sample, which is one of the lower values. It is highly unlikely that a package that is used as regularly as ComplexHeatmap would be doing something so obviously incorrect and nobody but you has noticed.

ADD COMMENT
0
Entering edit mode

Put a different way, I see no difference between these two plots

> library(ComplexHeatmap)
> library(gplots)
> set.seed(0xabeef)
> mat <- matrix(rnorm(100), 10)
> heatmap.2(mat, dendrogram = "none", trace = "none", density.info = "none", col = colorpanel(1000, "blue","white", "red"), key = FALSE, lhei = c(2,10), Rowv = FALSE, Colv = FALSE)
> Heatmap(mat, cluster_rows = FALSE, cluster_columns = FALSE)
ADD REPLY
0
Entering edit mode

Or these two

> heatmap.2(mat, dendrogram = "none", trace = "none", density.info = "none", col = colorpanel(1000, "blue","white", "red"), key = FALSE, lhei = c(2,10), Rowv = FALSE, Colv = FALSE, scale = "row")
> Heatmap(t(scale(t(mat))), cluster_rows = FALSE, cluster_columns = FALSE)
ADD REPLY

Login before adding your answer.

Traffic: 907 users visited in the last hour
Help About
FAQ
Access RSS
API
Stats

Use of this site constitutes acceptance of our User Agreement and Privacy Policy.

Powered by the version 2.3.6