Entering edit mode

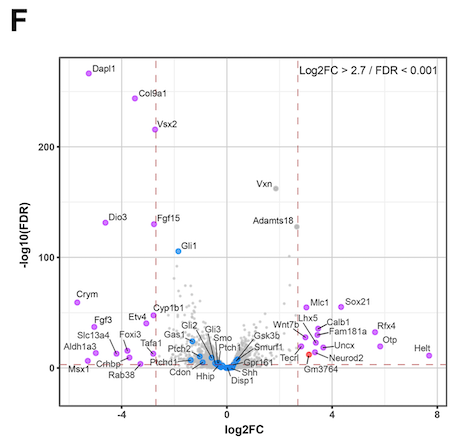
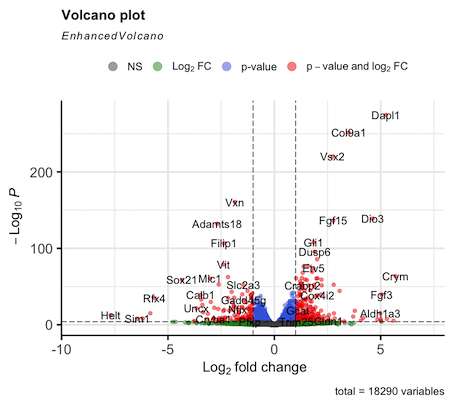
Hello. I am running DEseq2 analysis on published RNAseq data consisting of 4 control samples and 4 cKO samples. However my log2FC values are inverted compared to the original publication. I think the issue is with how I define the control group (#set factor level) as the plotted data is always appears the same irrespective of what group I select (Control or cKO). I am struggling to find a solution here as I am new to DEseq2 so I am reaching out for some help. I attach the volcano plot images for comparison and my script. Thanks in advance.
#load libraries
library(dplyr)
library(tidyverse)
library(GEOquery)

#prepare data
reads <-read.csv(file = "GSE172457.csv")
colnames(reads) [1] <- "gene"
colnames(reads) [2] <- "GSM5257109"
colnames(reads) [3] <- "GSM5257110"
colnames(reads) [4] <- "GSM5257111"
colnames(reads) [5] <- "GSM5257112"
colnames(reads) [6] <- "GSM5257113"
colnames(reads) [7] <- "GSM5257114"
colnames(reads) [8] <- "GSM5257115"
colnames(reads) [9] <- "GSM5257116"
reads <- reads %>% separate(gene, into = c("ENSEMBL", "gene","gene_biotype"), convert = TRUE)
reads <- reads[, -c(2,3)]
rownames(reads) <- reads$ENSEMBL
reads <- reads[, -c(1)]

#get metadata
gse<- getGEO(GEO = 'GSE172457', GSEMatrix = TRUE)
metadata <- pData(phenoData(gse[[1]]))

#select column subsets from metadata and rename columns
metadata.subset <- metadata %>%
  select(1) %>%
  rename(genotype = title) %>%
  mutate(genotype = gsub("replicate 1", "", genotype)) %>%
  mutate(genotype = gsub("replicate 2", "", genotype)) %>%
  mutate(genotype = gsub("replicate 3", "", genotype)) %>%
  mutate(genotype = gsub("replicate 4", "", genotype))

#check sample information
all(colnames(reads) %in% rownames(metadata.subset))
all(colnames(reads) == rownames(metadata.subset))

#construct a DESeqDataSet
library(DESeq2)
dataset <- DESeqDataSetFromMatrix(countData = reads,
                                  colData = metadata.subset,
                                  design = ~ genotype)

#filtering data
#only keep rows that have at least 20 reads
dataset.filter <- rowSums(counts(dataset)) >= 20
dataset <- dataset[dataset.filter,]

#set factor level
metadata.subset$genotype <- as.factor(metadata.subset$genotype)
metadata.subset$genotype <- relevel(metadata.subset$genotype, ref = "Control ")

#run DEseq with p-value of 0.0001
dataset <- DESeq(dataset)
results <- results(dataset, alpha = 0.0001)
summary(results)

#load libraries for volcano plotting
library(org.Mm.eg.db)
library(EnhancedVolcano)

#convert results to a dataframe and add gene names
results.df <- as.data.frame(results)
results.df$symbol <- mapIds(org.Mm.eg.db, keys = rownames(results.df), keytype = "ENSEMBL", column = "SYMBOL")

#volcano plot
EnhancedVolcano(results.df, x = "log2FoldChange", y = "padj", lab = results.df$symbol,
                pCutoff = 1e-4, FCcutoff = 1)


> sessionInfo( )
R version 4.2.2 (2022-10-31)
Platform: x86_64-apple-darwin17.0 (64-bit)
Running under: macOS Ventura 13.0.1

Matrix products: default
LAPACK: /Library/Frameworks/R.framework/Versions/4.2/Resources/lib/libRlapack.dylib

locale:
[1] en_US.UTF-8/en_US.UTF-8/en_US.UTF-8/C/en_US.UTF-8/en_US.UTF-8

attached base packages:
[1] stats4    stats     graphics  grDevices utils     datasets  methods   base

other attached packages:
 [1] EnhancedVolcano_1.16.0      ggrepel_0.9.2               org.Mm.eg.db_3.16.0         AnnotationDbi_1.60.0        DESeq2_1.38.2
 [6] SummarizedExperiment_1.28.0 MatrixGenerics_1.10.0       matrixStats_0.63.0          GenomicRanges_1.50.2        GenomeInfoDb_1.34.4
[11] IRanges_2.32.0              S4Vectors_0.36.1            GEOquery_2.66.0             Biobase_2.58.0              BiocGenerics_0.44.0
[16] forcats_0.5.2               stringr_1.5.0               purrr_1.0.0                 readr_2.1.3                 tidyr_1.2.1
[21] tibble_3.1.8                ggplot2_3.4.0               tidyverse_1.3.2             dplyr_1.0.10                biomaRt_2.54.0

loaded via a namespace (and not attached):
 [1] bitops_1.0-7           fs_1.5.2               lubridate_1.9.0        bit64_4.0.5            RColorBrewer_1.1-3     filelock_1.0.2
 [7] progress_1.2.2         httr_1.4.4             tools_4.2.2            backports_1.4.1        utf8_1.2.2             R6_2.5.1
[13] DBI_1.1.3              colorspace_2.0-3       withr_2.5.0            tidyselect_1.2.0       prettyunits_1.1.1      bit_4.0.5
[19] curl_4.3.3             compiler_4.2.2         cli_3.5.0              rvest_1.0.3            xml2_1.3.3             DelayedArray_0.24.0
[25] labeling_0.4.2         scales_1.2.1           rappdirs_0.3.3         digest_0.6.31          R.utils_2.12.2         XVector_0.38.0
[31] pkgconfig_2.0.3        dbplyr_2.2.1           fastmap_1.1.0          limma_3.54.0           rlang_1.0.6            readxl_1.4.1
[37] rstudioapi_0.14        RSQLite_2.2.20         farver_2.1.1           generics_0.1.3         jsonlite_1.8.4         BiocParallel_1.32.5
[43] R.oo_1.25.0            googlesheets4_1.0.1    RCurl_1.98-1.9         magrittr_2.0.3         GenomeInfoDbData_1.2.9 Matrix_1.5-3
[49] Rcpp_1.0.9             munsell_0.5.0          fansi_1.0.3            R.methodsS3_1.8.2      lifecycle_1.0.3        stringi_1.7.8
[55] zlibbioc_1.44.0        BiocFileCache_2.6.0    grid_4.2.2             blob_1.2.3             parallel_4.2.2         crayon_1.5.2
[61] lattice_0.20-45        Biostrings_2.66.0      haven_2.5.1            annotate_1.76.0        hms_1.1.2              KEGGREST_1.38.0
[67] locfit_1.5-9.6         pillar_1.8.1           geneplotter_1.76.0     codetools_0.2-18       reprex_2.0.2           XML_3.99-0.13
[73] glue_1.6.2             data.table_1.14.6      modelr_0.1.10          png_0.1-8              vctrs_0.5.1            tzdb_0.3.0
[79] cellranger_1.1.0       gtable_0.3.1           assertthat_0.2.1       cachem_1.0.6           xtable_1.8-4           broom_1.0.2
[85] googledrive_2.0.0      gargle_1.2.1           memoise_2.0.1          timechange_0.1.1       ellipsis_0.3.2
>

Thanks for the reply, Michael. Doesn't the following line in my script define the factor level?
metadata.subset$genotype <- relevel(metadata.subset$genotype, ref = "Control ")No because you are changing the factor levels of a column of a data.frame that was already used to create the dds.
R does not connect these objects. When you make the
ddsthe information you provide as colData is copied into thedds. Modifying the original data.frame doesn't propagate changes to the thedds.You can modify the information in the
ddswith:Thanks again for the reply. I understand now. I set the factor levels prior to creating the dataset and it worked. Cheers!