Entering edit mode

Hello,
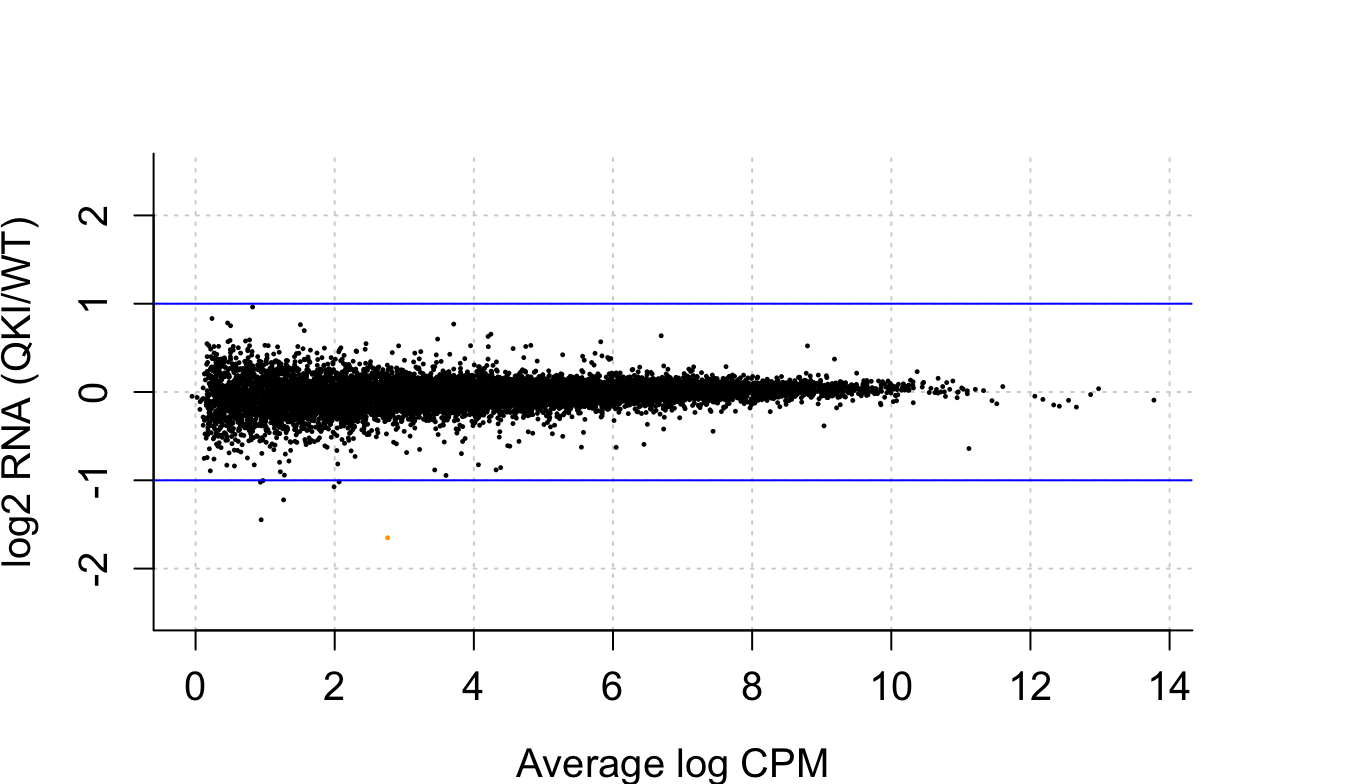
I am trying to make a smear plot with edgeR to look at and RNA-seq data set that has no statistically significant differentially expressed genes. When I plot this, I get a few points that are orange, and I can't find anywhere what this is indicative of. I know red is differentially expressed, but unsure what orange is referencing
y2 <- DGEList(counts=data2,group=group)
keep <- rowSums(cpm(y2)>1) >=6
y2 <- y2[keep, ,keep.lib.sizes=FALSE]
y2 <- calcNormFactors(y2)
y2 <- estimateCommonDisp(y2)
y2 <- estimateTagwiseDisp(y2)
et2 <- exactTest(y2, pair = c("WT","KI"))
topTags_sig_genes<- topTags(et2, n=10000, adjust.method = "BH", sort.by = "PValue", p.value = 0.05)
is.de <- decideTestsDGE(et2, p.value=0.05)
summary(is.de)

op <- par(mar = c(4,4,4,4))
par(bty="l")
plotSmear(et2, de.tags=rownames(et2)[is.de!=0], xlab = "Average log CPM", ylab = "log2 RNA (QKI/WT)",
   ylim = c(-2.5,2.5),cex.lab = 1.25, cex.axis = 1.25)
abline(h=c(-1, 1), col="blue")

This worked! Thank you so much :)
I noticed that the orange dot with plotSmear is plotted at a slightly lower value than it should be, whereas it is plotted at the correct value with plotMD. I wonder if plotSmear is somehow adjusting the point in since it is a large fold-change?