Entering edit mode

Hi there,
I have done gsva using the code below. But, when plotting the results. I found something that couldnt explain, where gene lists that I used are more enriched in the Control group which cant be true. Any help would be appriciated. Many thanks
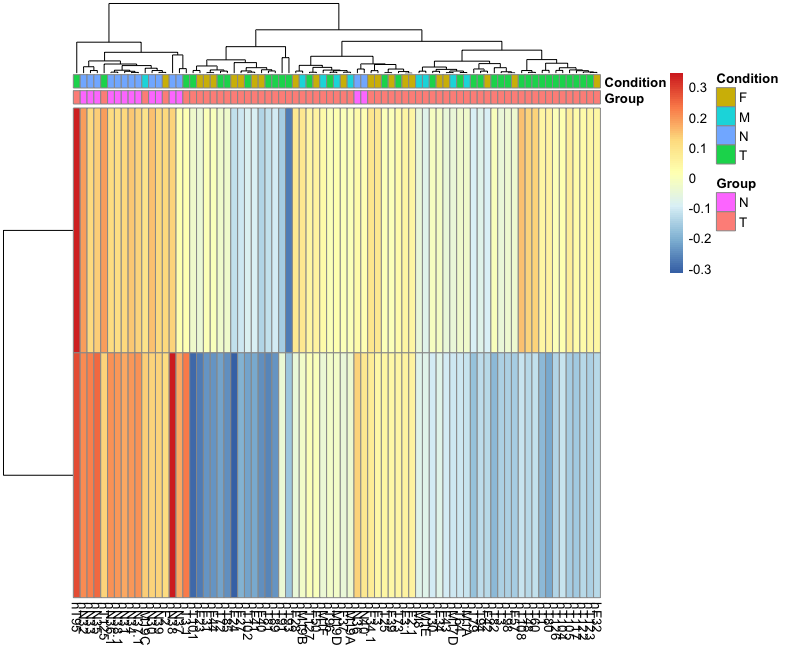
gsva <- gsva(
  mapped_vst,
  Glists,
  method = "gsva",kcdf = "Poisson",
  mx.diff = TRUE,
  verbose = FALSE)

Hi, Thank you for your reply, but removing
kcdf="Poisson"didnt effect the results too much. Still, have the same pattern. Many thankshi, as I said, there may be many reasons why a downstream result or a graphical diagnostic, such as a hierarchical clustering, may depart from what you expect, and the GSVA algorithm may or may not be one of those reasons. If the GSVA algorithm was the reason, then maybe other methods implementing different algorithms may give you the result you expect. The GSVA package implements three other methods, check out the help page of the
gsva()function, doinghelp(gsva), and try them. If you do not get the expected result with any of the four methods, you may still try other approaches implemented in a different package/software such as, for instance, the singscore or qusage packages. If none of those give you the expected result, probably the problem is not on the single sample gene set enrichment score algorithm.I'd suggest then to pick a few of the genes for which you know how do they should change across sample groups and plot their expression values by sample group using, for instance, box plots. If they the behave as you expect, maybe you have an error in the code that builds and displays the hierarchical clustering. If they do not behave as you expect, then the data you have probably does not match your hypothesis.