
I’m working with untargeted metabolomics data from samples that we run on two different column types (C18 and HILIC), both in positive and negative mode, for a total of four tables of (m/z + retention time vs. samples), which I generated using XCMS online. My goal now is to identify differentially abundant peaks, as one does with gene expression for RNA.
I filtered features for a given table as one typically does for RNA, I excluded a peak if it was not present in at least k % of samples, where k is defined as the minimum proportion of a given group in the comparison (here, sick = 0.6 and healthy = 0.4, so I required that a given peak be detected in at least 0.4 % of samples to be included in the analysis). I have 15 samples total, where 6 are sick. There was a technical factor that contributed considerably to the variation so I blocked with it in the design matrix (‘sick_A’, ‘sick_B’, ‘healthy_A’, ‘healthy_B’). I treated another biological covariate (age) that is not of direct interest but could contribute to variability as a column in the design matrix.
In terms of identifying differentially abundant peaks, I followed Gordon’s advice here, where I’m transforming the abundance matrix log2 counts, performing quantile normalization, then running a limma pipeline with eBayes(trend=TRUE, robust=TRUE). Putting the code at the end of the post.
Questions:
- Are there additional/newer guidances from this post from Gordon that I should follow?
- Are there guidelines for what the density plot should look like following quantile normalization between arrays? This is what I’m getting:
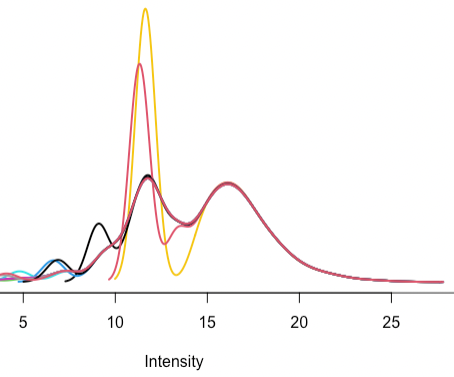
The red and yellow samples also have outlier total ion chromatogram plots and I’m figuring out what to do.
- Thoughts on using POMA vs limma? I’m most familiar with limma/voom and wanted to ask first.
- Are there guidelines for correction between runs (e.g positive vs. negative mode on a given column?)? Any thoughts on how necessary this is? I did not just knit the two matrices together and treat duplicate patient ID as a random effect since there is no overlap in the features between the positive and negative run - they’re independent data collection events - so I'd get a matrix with two blocks, one . I know when comparing related contrasts I can do
decideTests; but that’s within a given run.
sample code
log2_counts <- log2(counts + 1)
normalized <- normalizeBetweenArrays(log2_counts, method="quantile")
fit <- lmFit(normalized, design = design)
fit2 <- contrasts.fit(fit, contrast.matrix)
fit3 <- eBayes(fit2, trend = TRUE, robust = TRUE)
topTable(fit3, sort.by = "P", number = Inf)
