Entering edit mode

Hi everybody, I'm using EdgeR to find differential expressed genes induced by diet. I have two group (5 mice in standard diet (SD) and 5 mice in Diet1 (KD)). In both groups I have males and females, respectively 2F+3M and 3F+2F
Analysis is carried out using the following code
library(edgeR)
library(ggplot2)
#make DGElist
DG <- DGEList(matrix, group= group)
DG$samples$name= x$description
DG$samples$sex= x$Sex
#filtering
keep <- filterByExpr(d)
d <- d[keep,]
d$samples$lib.size <- colSums(d$counts)
#TMM normalization
d <- calcNormFactors(d, method = "TMM")
logCPM <- cpm(d, log=TRUE , prior.count=1)
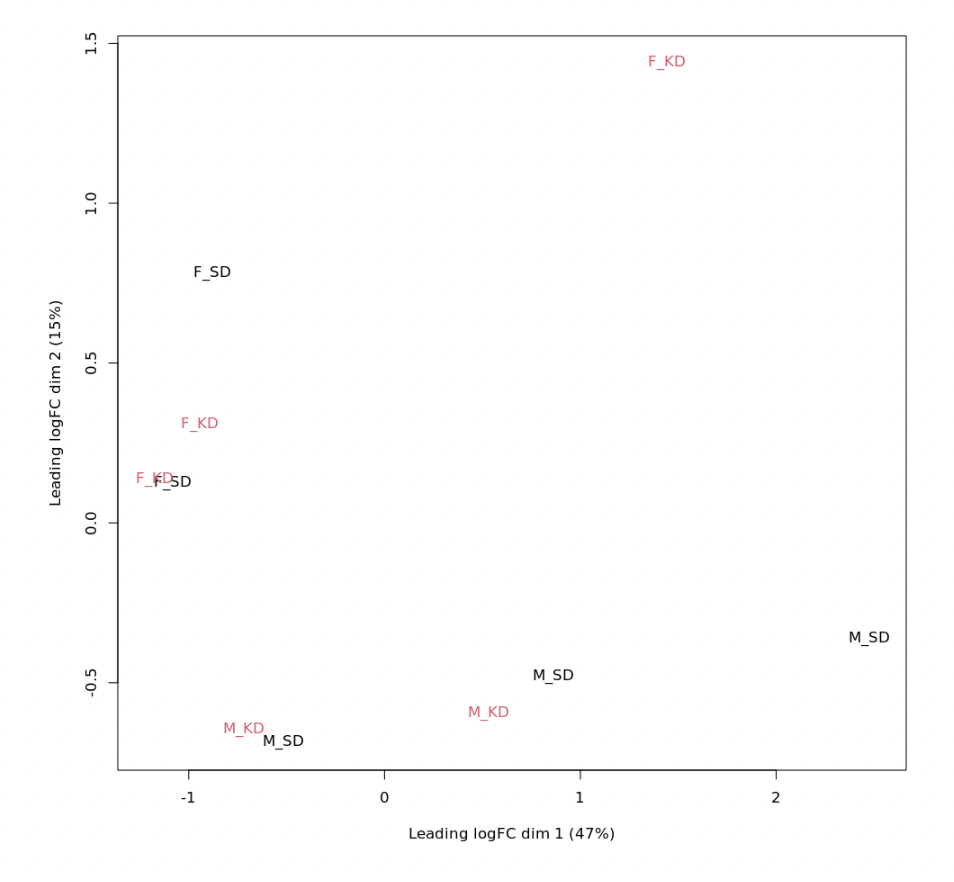
#MDS plot (Fig1)
plotMDS(logCPM, labels=as.factor(d$samples$Experiment), col=rep(1:4, each=5))
As possible to see in MDS plot (Fig1), clustering is sex driven, indeed I lost observed clusterization when I run
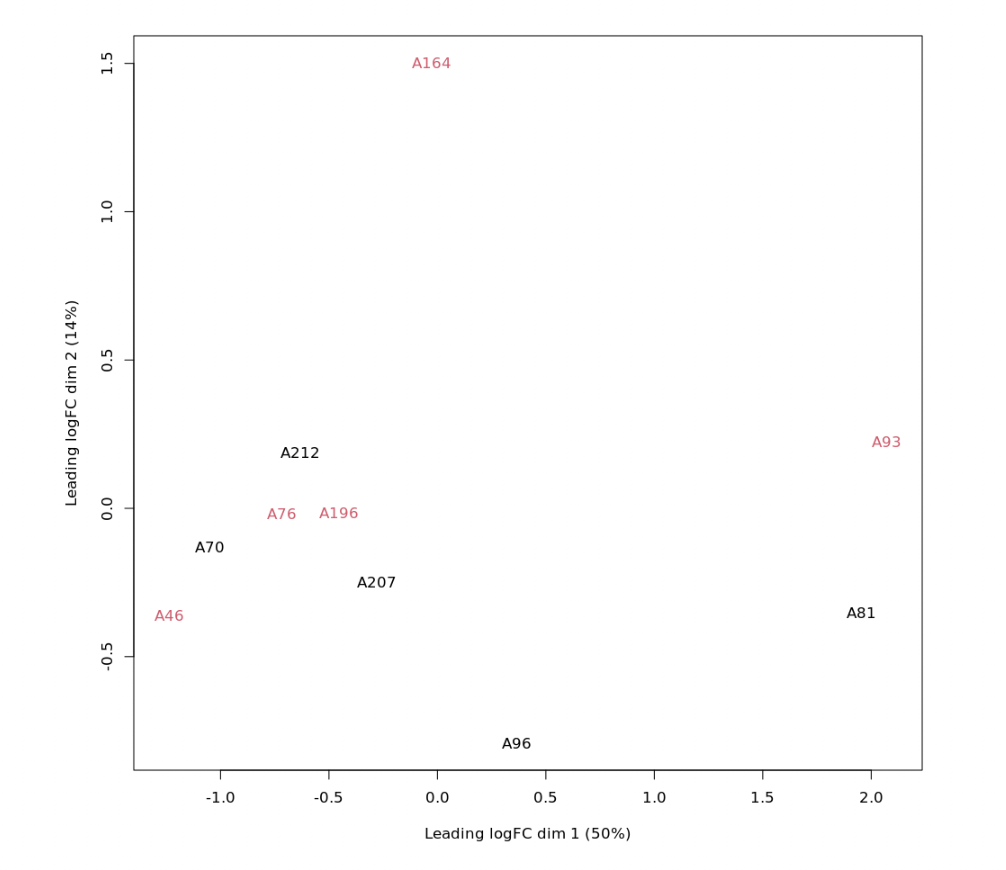
logCPM_batch <- removeBatchEffect(logCPM, batch=DG$samples$sex)
plotMDS(logCPM_batch, labels=as.factor(d$samples$name), col=rep(1:4, each=5))
See Fig2
To investigate the impact of diet (removing sex effect) I have designed the matrix as follow and proceed with following code
design.mat <- model.matrix(~d$samples$sex+ d$samples$group)
d <- estimateDisp(d, design.mat)
fit <- glmFit(d, design.mat)
lrt12 <- glmLRT(fit, coef = 2)
lrt12$table$FDR= p.adjust(lrt12$table$PValue, method = "BH")
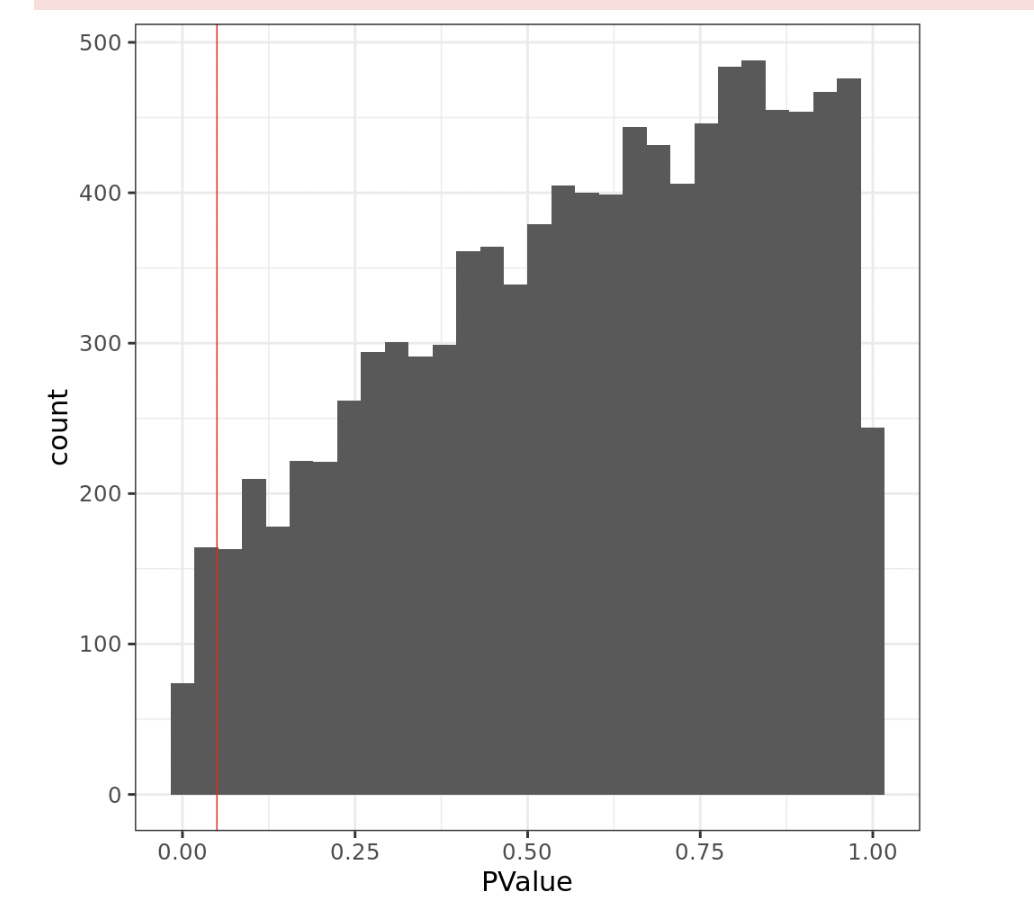
However, looking the pvalue histogram I have a hill-shaped p-value distributions (see Fig3)
x= lrt12$table
ggplot(data = x, aes(x=PValue)) + geom_histogram()+ theme_bw(base_size = 22)+ geom_vline(xintercept = 0.05, col="red")
What I'm doing wrong?? What I can do to be sure about results?? please can you help me?
thanks a lot in advance
Giuseppe

Dear Gordon, thanks for your reply. Apologize, It's my copy/paste mistake.
Fig3 came from right comparison (SD vs KD)
Your MDS plots show that there is little (no) concordance in your replicates so large pvalues are expected.
Under the null, p-values are uniformly distributed, so that p-value histogram should be close to flat.
Are there any signficantly DE genes for the comparison? You don't seem to have completed the edgeR DE pipeline and examined results from
topTagsordecideTests.Your use of
removeBatchEffectis not correct because you have omitted thedesignmatrix from the call. You must specify this argument in order to get meaningful results.removeBatchEffectneeds to know that group is the other factor in your model.I have not seen a p-value histogram like yours and it does seem very surprising. However the shape of the histogram is irrelevant. There is nothing in the edgeR documentation recommending p-value histograms or promising that you will see a flat histogram. It is perfectly possible to get a skew histogram if many of the genes have low counts leading to low power for the statistical test for those genes. In general, count data does not lead to flat p-value histograms. You have drawn a line on your plot for p=0.05, but raw p-values cannot be compared to a 0.05 cutoff.
The MDS plot suggest that your data has huge problems, with a very large sex effect and other batch effects as well. No statistical software will make the results look like a textbook example. What did you expect edgeR to do for you that it hasn't?
We recommend the edgeR quasi pipeline and you have used edgeR quasi in the past. Is there a reason why you are not using glmQLFit() etc for this data?
It probably makes little difference, but why over-ride the
cpmdefault value forprior.count?