
In our experiment, there are 564 samples of 181 conditions, where all but a few control conditions are in triplicate.
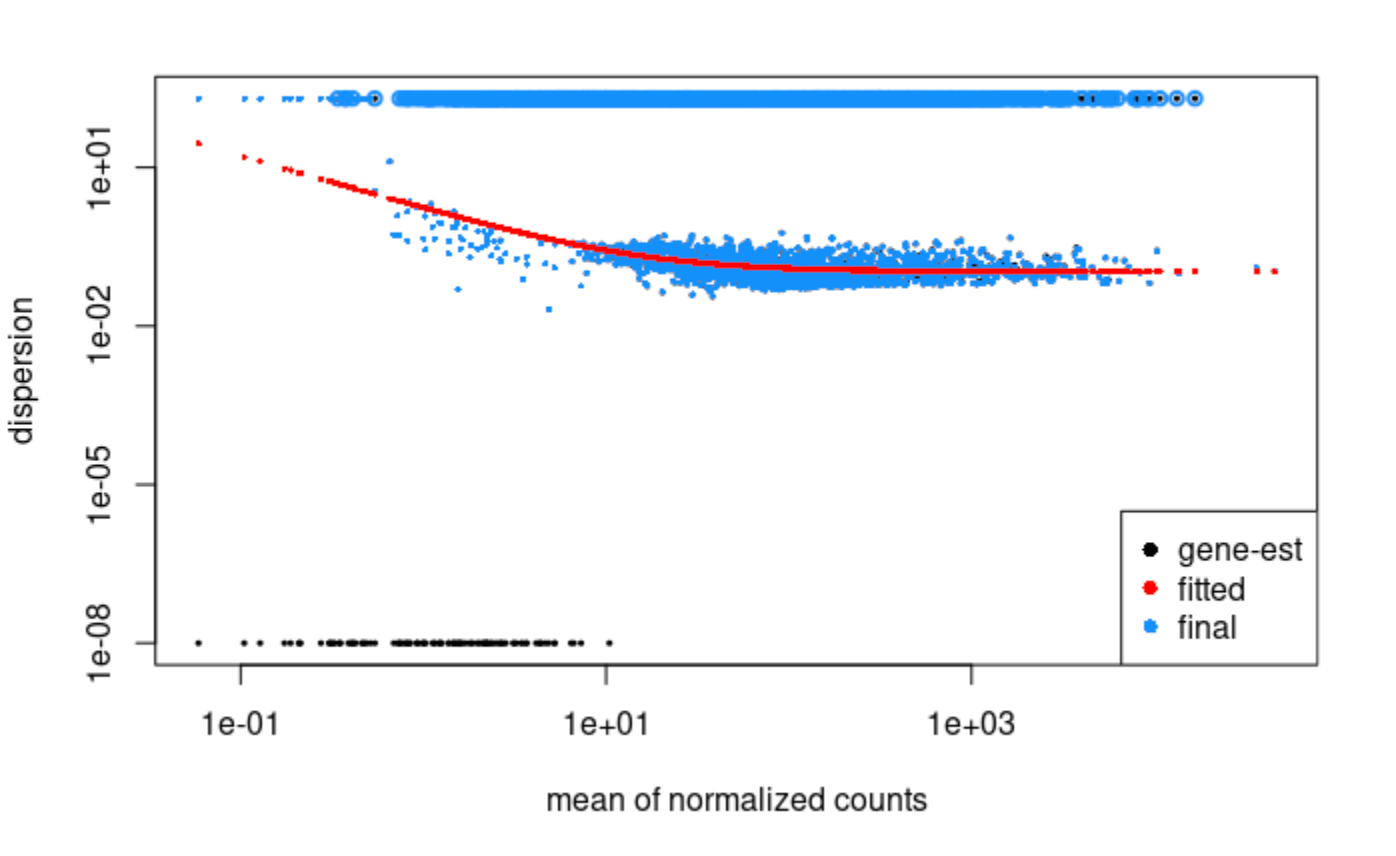
16 of these samples have low reads, and before and after removing these samples, the dispersion plot looks like this and we notice some weird behavior (see questions below):
Questions:
1) Why are dispersion values maxing out with no intermediate dispersion values? And why do so many genes have the same dispersion value (the genes at the top do indeed have identical values)? This occurs regardless of low read sample removal.
2) We noticed two things after removing low quality samples (16 out of 564 samples removed due to low total reads). First, the dispersion values for 29% of genes jump into this high dispersion group, going from near the dispersion trend line up to the maximal saturation value (again, there are no intermediate values). Second, after removing these 16 samples, the significance of the LFC for many genes changes from significant to not significant for the same contrast. For example, the p-adj for a gene in the same contrast goes from ~1e-19 to 0.999, even though the normalized counts within the groups for that contrast are not very different. This affects many genes - for example, in one of our contrasts, about 40% of the genes go from being significantly differentially expressed to not significant.

Thank you for your response! Here are some examples of plotCounts for high mean/high dispersion genes:
We also used RUVs to model batch effects and after re-running DESeq (on the full dataset with no samples removed), we saw that some genes had a higher dispersion afterwards. For example, gene recA (below) went from having a dispersion of 0.07 to ~201 (falling into that maximal dispersion group). Do you know why this might be happening? I'm not sure I understand why dispersion would shoot up after accounting for unwanted variation. Here's the plotCounts for this specific gene as well as dispersion vs. mean plots with recA highlighted in red from our original DESeq run (top) compared to running DESeq after using RUV (bottom):