Entering edit mode

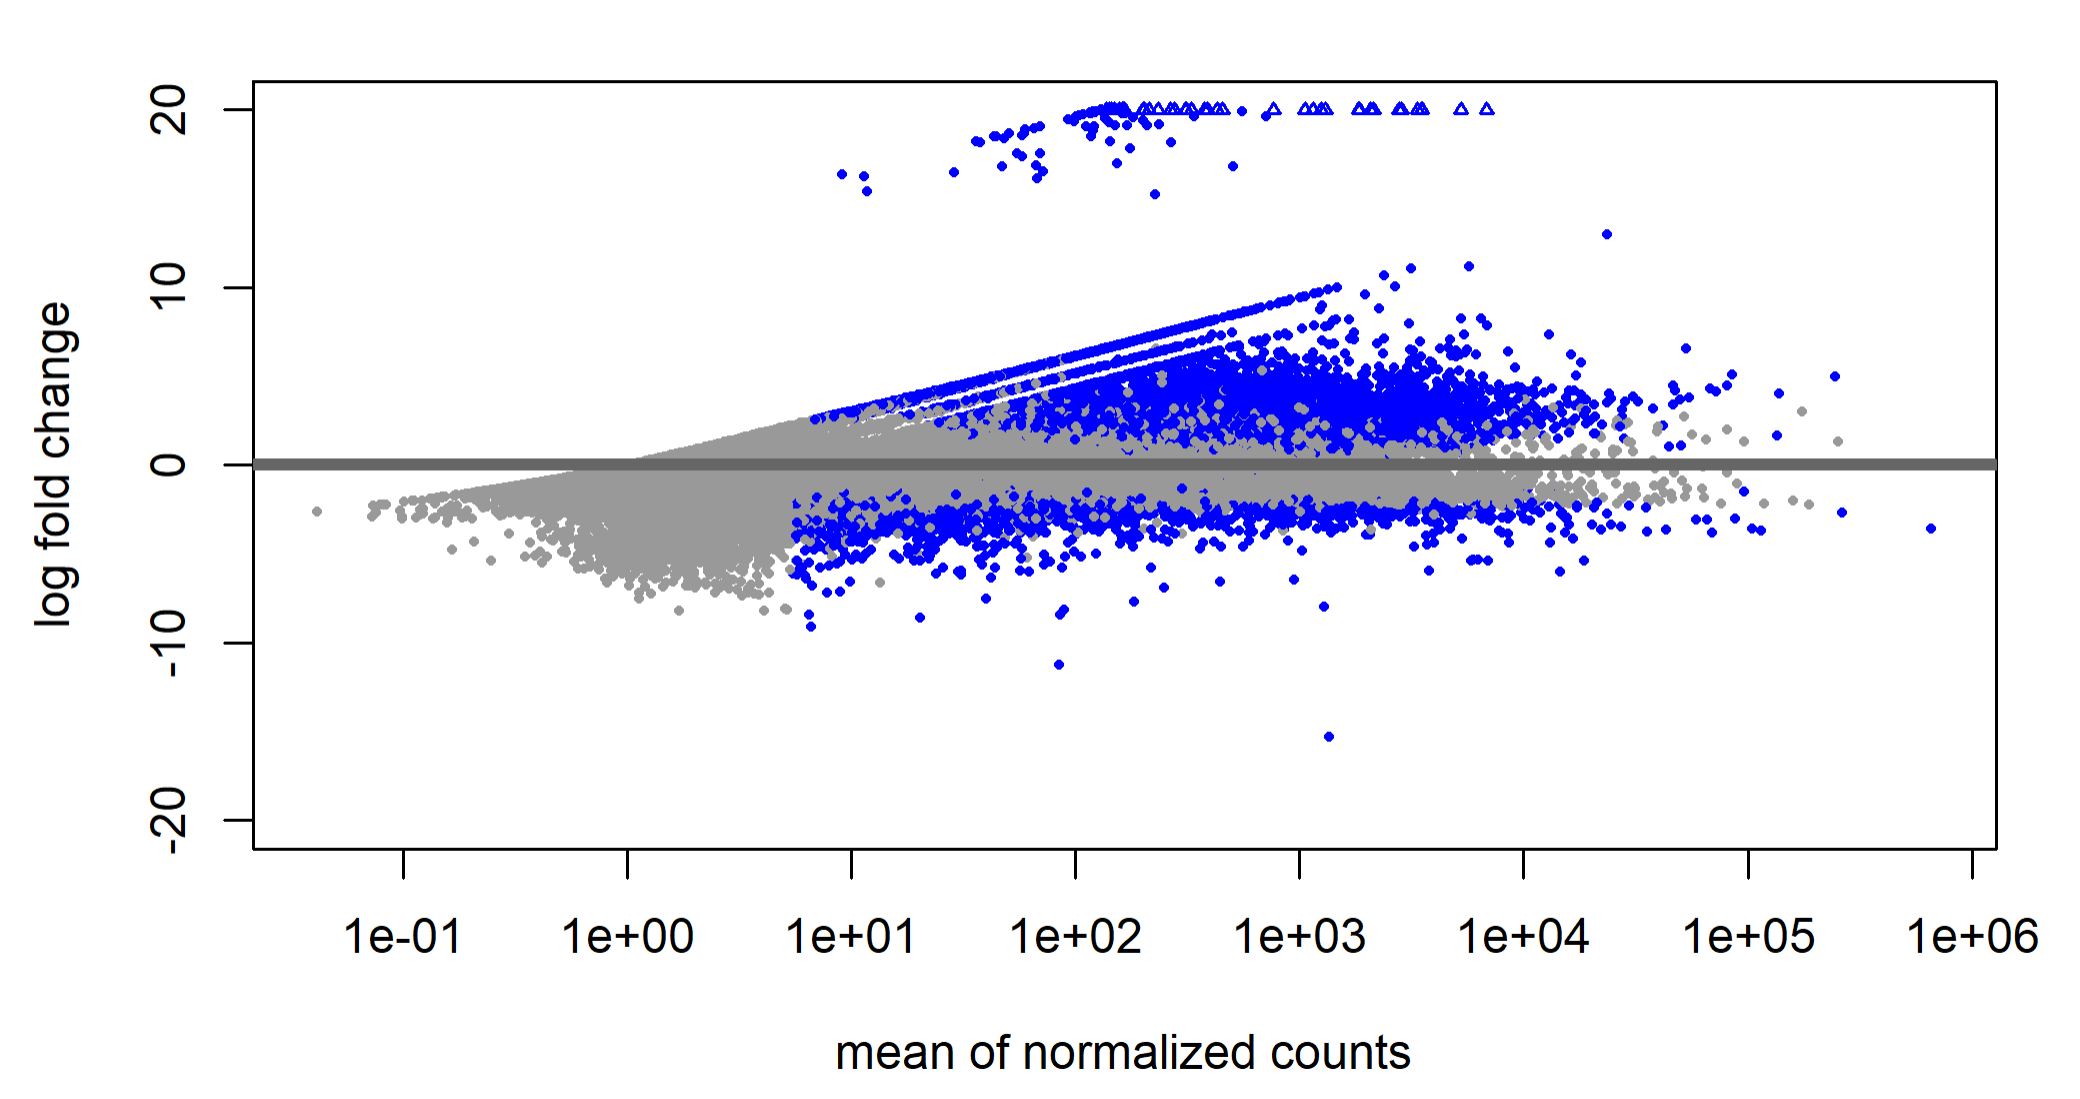
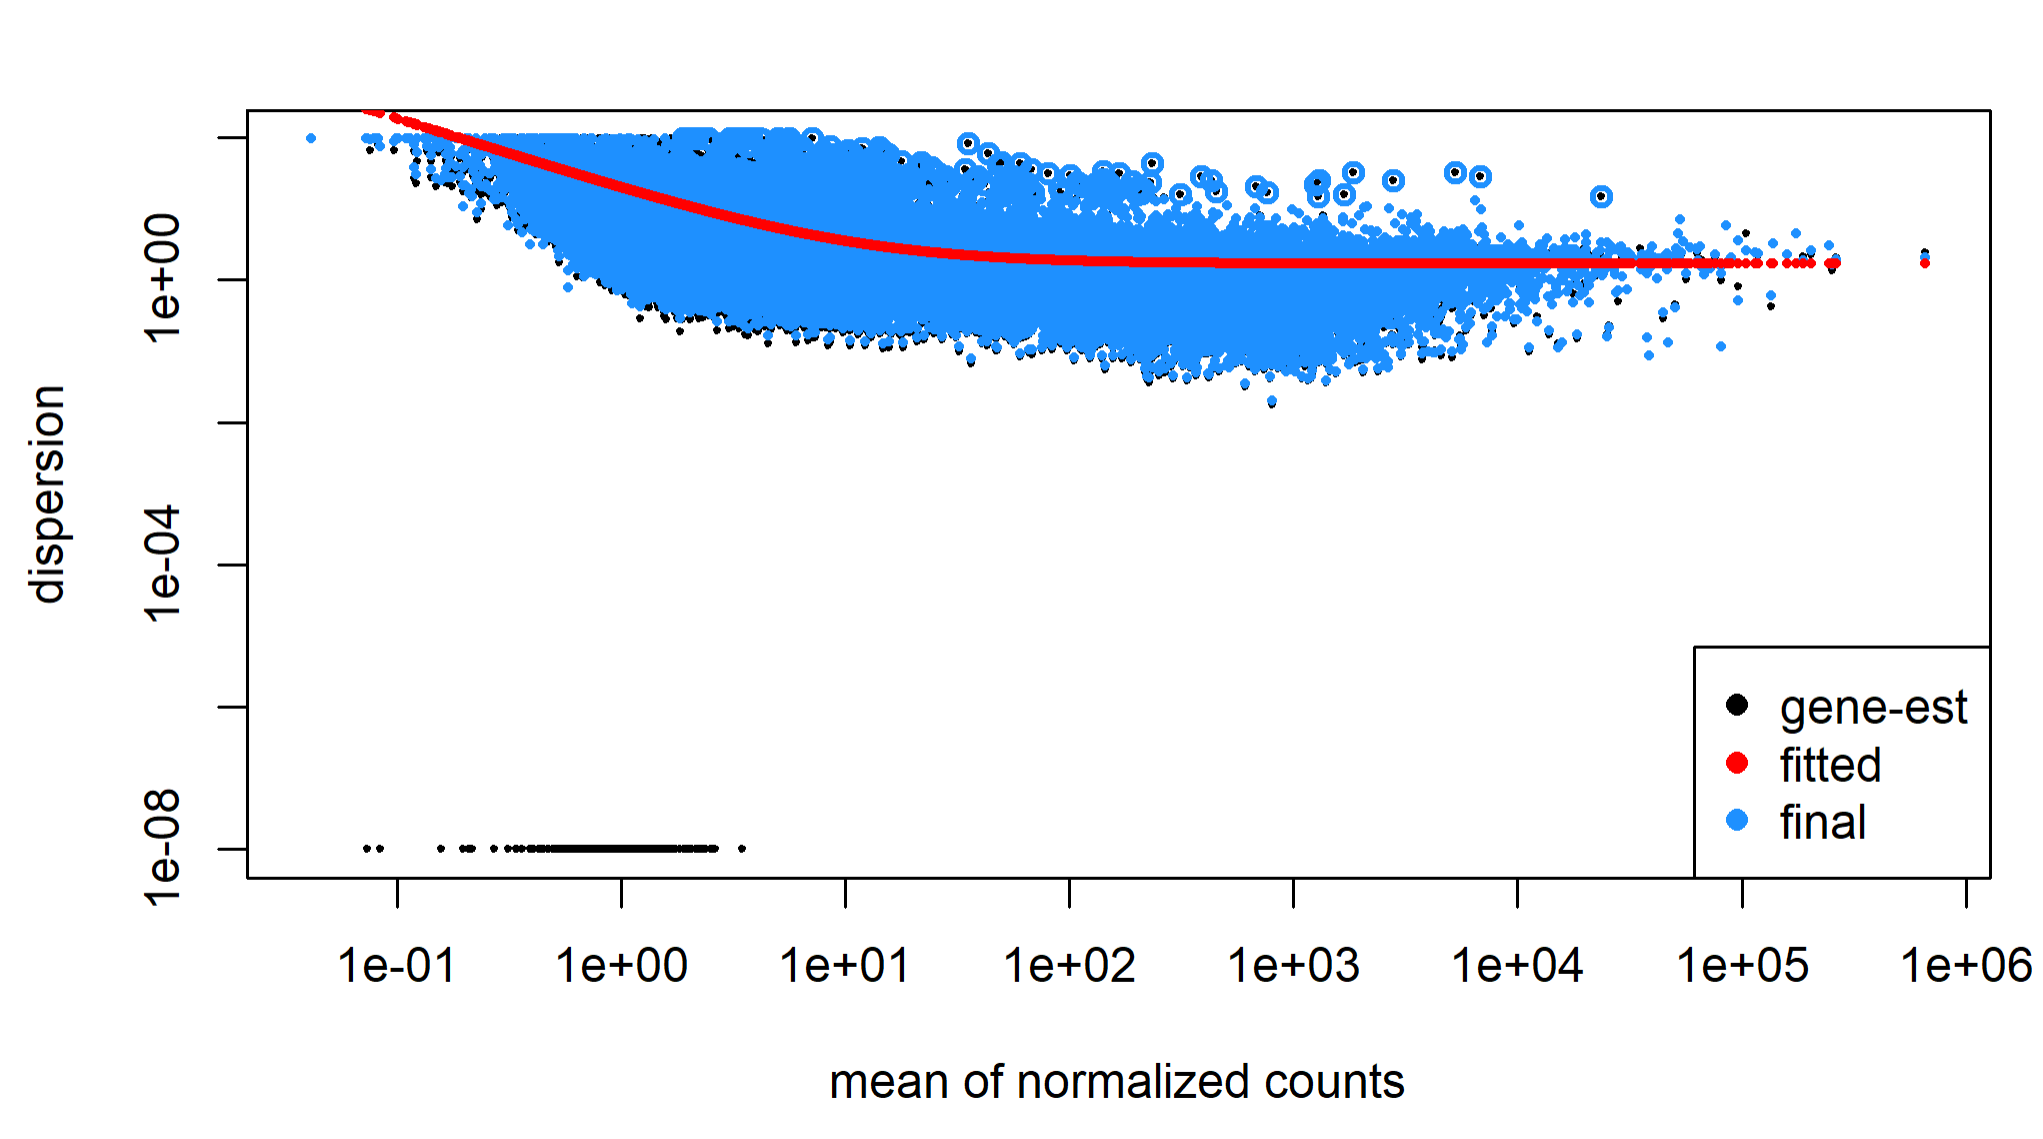
I have 99 samples (cancer cells in duplicates or triplicates, and 3 replicates of normal cells) subjected to bulk RNA seq. All the Fastqc parameters look fine + the sequencing depth is pretty similar across all samples. I generated gene counts for all of them with htseq, filtered using EdgeR and ran DeSeq2 on it. Now I'm visualizing the results with the dispersion plot & MA plot and it's very asymmetric. There's also 23% upregulated genes and only 2% downregulated. I can't figure out what exactly this indicates, and what I should do?