
Hi!
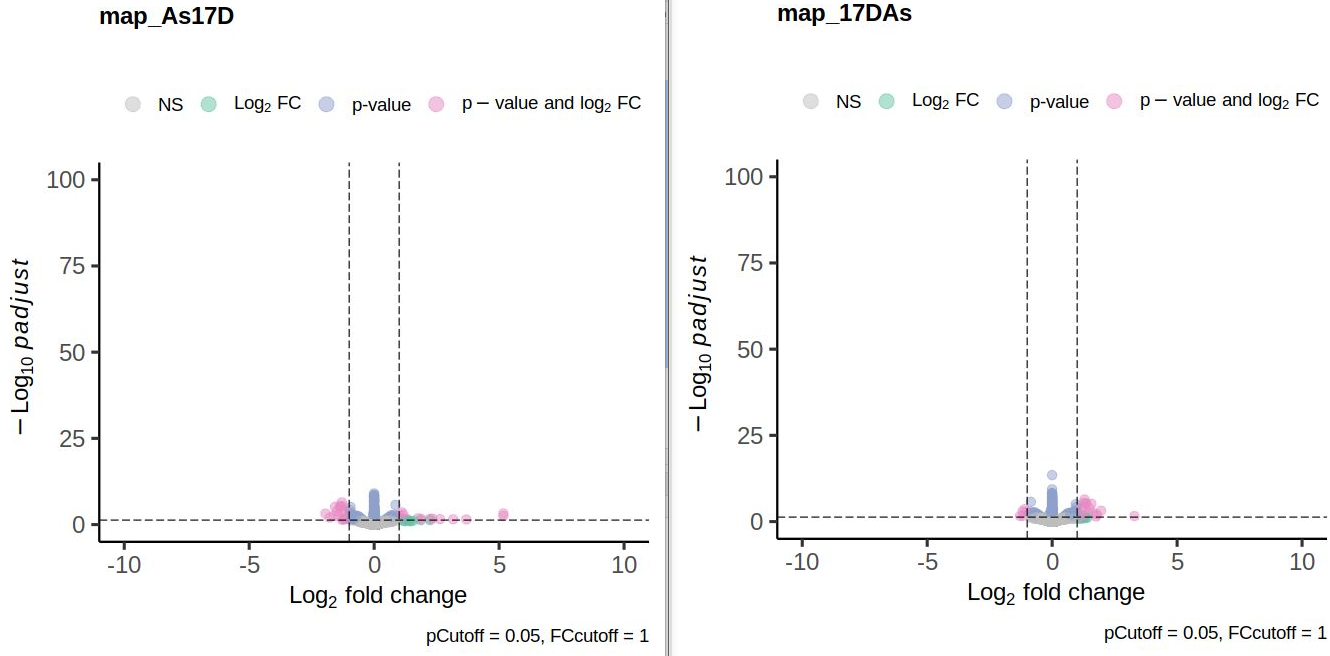
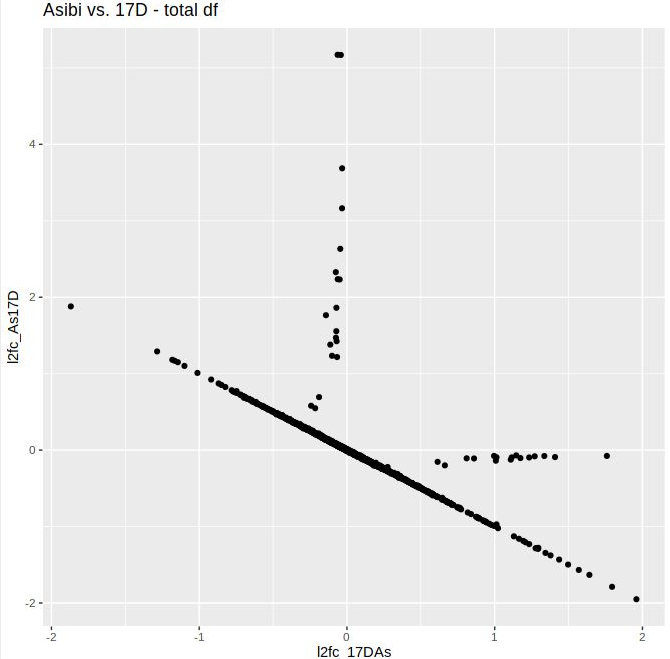
I noticed that my volcano plots resulting from lfcShrink() on contrast A_vs_B look different from the results of lfcShrink() on B_vs_A. I expected the absolute values of the l2FC to be approximately similar, but they are skewed towards the upregulated genes, i.e. the positive l2FC values tend to be higher in both comparisons. The unshrunken values behave as expected; the volcano plots are flipped along the y-axis. When I plotted the shrunken l2FCs of both contrasts against eachother, the vast majority was linearly distributed, but some (including some significant ones) deviated quite a bit from that. Thus, the ranking changes as well as the visulal representation. I tested this mostly using apeglm, but when I tried ashr, the absolute values didn't match up either. There are not too many DGEs in this data set, otherwise I might have missed it.
I hope you can help me clear this up, since intuitively, I don't see why the order of the contrast should have an impact on the absolute l2FC values and I'm not sure what it means for my experiment.
Thanks in advance! Maike
This is my code:
# A vs B
coldata$strain <- relevel(coldata$strain, 'B')
dds <- DESeqDataSetFromMatrix(countData = cts,
                              colData = coldata,
                              design = ~ donor + strain)
dds <- DESeq(dds)
# raw (non-shrunken) DEG results:
res_AB <- results(dds, name = "strain_A_vs_B")
# shrink:
map_AB <- lfcShrink(dds, coef = "strain_A_vs_B")

# B vs A
coldata$strain <- relevel(coldata$strain, 'A')
dds <- DESeqDataSetFromMatrix(countData = cts,
                              colData = coldata,
                              design = ~ donor + strain)
dds <- DESeq(dds)
# raw (non-shrunken) DEG results:
res_BA <- results(dds, name = "strain_B_vs_A")
# shrink:
map_BA <- lfcShrink(dds, coef = "strain_B_vs_A")

# l2fc plot:
# plot: compare L2FCs - all values:
df <- data.frame (row.names = rownames(as.data.frame(map_AB)))
df$l2fc_AB <- (as.data.frame(map_AB)$log2FoldChange)
df$l2fc_BA <- (as.data.frame(map_BA)$log2FoldChange)

Plot_01 <- ggplot(df, aes(x=l2fc_AB, y=l2fc_BA)) +
  geom_point()
Here are the volcano plots aand the scatter plot:

Thank you a lot! I missed that post when I was trying to to find out what is happenenig. The ranking missmatch I observed was indeed due to low readcounts in one of the saples and prefiltering removed the affected genes.