Removing Unwanted Variations
1
0
Entering edit mode
AZ ▴ 30
@fereshteh-15803
Last seen 11 months ago
United Kingdom

Hi

I have treatment versus control collected in eight batches (NanoString transcriptome)

I have tried NanoStringNCTools and RUVseq to remove unwanted variations

Here I suppose my eight batches can introduce unwanted technical variations

I have twenty housekeeping genes in my panel using them I want to combat with unwanted variations

So,

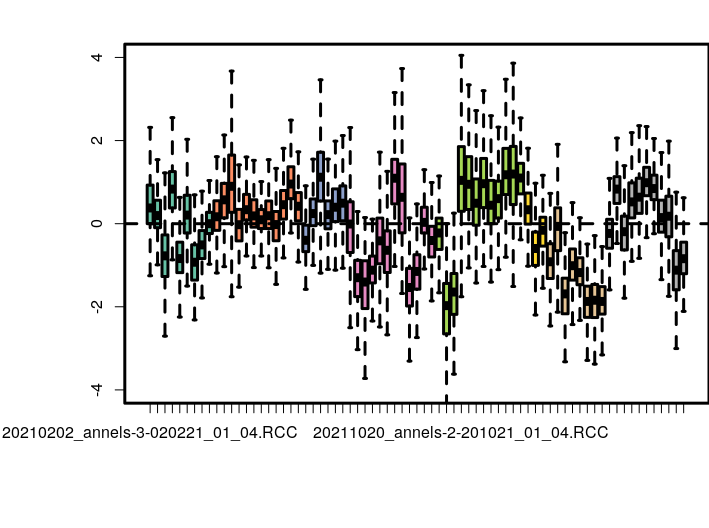
## ----ruv_spikes, fig.cap="RUVg normalization based on spike-in controls.", fig.subcap=c("RLE plot","PCA plot")----
set1 <- RUVg(set, spikes, k=1)
pData(set1)

enter image description here

> set1$x
 [1] 1 1 1 1 1 1 1 1 1 2 2 2 2 2 2 2 2 2 2 2 2 3 3 3 3 3 3 4
[29] 4 4 4 4 4 4 4 4 4 4 4 5 5 5 5 5 5 5 5 5 5 5 5 6 6 6 7 7
[57] 7 7 7 7 7 7 8 8 8 8 8 8 8 8 8 8 8
Levels: 1 2 3 4 5 6 7 8

Please ,if you just tell me what W_1 is embedded in set1?

I know x is the main design ; But I am sure W_1 comes from where?

Is that correcting factor based on spikes in gene?

For instance as a part of tutorial you mention

This is done by considering a design matrix that includes both the covariates of interest (here, the treatment status) and the factors of unwanted variation.

design <- model.matrix(~x + W_1, data=pData(set1))

I have both covariate of interest and some some batches, so shall I still include the batch in the formula?

What would be a formula comparing treatment/control, removing unwanted variation and deducing batches?

I am desperately confused

Thanks for any clarification

DESeq2 NanoStringNCTools RUVnormalize RUVSeq DifferentialExpression • 818 views
ADD COMMENT
1
Entering edit mode
ATpoint ★ 4.0k
@atpoint-13662
Last seen 6 hours ago
Germany

If you precisely know the batches, have you checked whether a) there is in fact evidence for batch effects in a PCA (see vignette) and b) if so then to simply include the batch information as a factor into the design rather than using more complicated methods like RUVseq? For a) I would normalize first to the controls using the controlGenes option in estimateSizeFactors(), then run vst() and then plotPCA() (or any PCA approach), coloring points by known batch. I would only use RUVseq (which has the downside that the choice of k is arbitrary) if the known batches cannot explain the unwanted variation.

ADD COMMENT
0
Entering edit mode

Thanks a million

I have done so

> dds <- DESeqDataSetFromMatrix(countData = counts(set),
+                               colData = pData(set),
+                               design = ~ Status_2) #counts(set)[1:652,], ##use design with W_1 or W_2 based on k value

> dds <- estimateSizeFactors(dds, controlGenes = rownames(dds) %in%rownames(housekeeping))
> dds <- DESeq(dds)
using pre-existing size factors
estimating dispersions
gene-wise dispersion estimates
mean-dispersion relationship
final dispersion estimates
fitting model and testing
-- replacing outliers and refitting for 20 genes
-- DESeq argument 'minReplicatesForReplace' = 7 
-- original counts are preserved in counts(dds)
estimating dispersions
fitting model and testing
> vsd <- varianceStabilizingTransformation(dds)
> dds
class: DESeqDataSet 
dim: 784 73 
metadata(1): version
assays(6): counts mu ... replaceCounts replaceCooks
rownames(784): CCNO MYC ... G6PD ERCC3
rowData names(23): baseMean baseVar ... maxCooks replace
colnames(73): 20210202_annels-3-020221_01_04.RCC 20210202_annels-3-020221_01_05.RCC ...
  20221014_cls-1-141022_01_10.RCC 20221014_cls-1-141022_01_11.RCC
colData names(15): Bacth_no Samp_no ... sizeFactor replaceable
> plotPCA(vsd, intgroup=c("Status_2", "Bacth_no"))
> pcaData <- plotPCA(vsd, intgroup=c("Status_2", "Bacth_no"), returnData=TRUE)
> percentVar <- round(100 * attr(pcaData, "percentVar"))
> ggplot(pcaData, aes(PC1, PC2, color=Bacth_no, shape=Status_2)) +
+   geom_point(size=3) +
+   xlab(paste0("PC1: ",percentVar[1],"% variance")) +
+   ylab(paste0("PC2: ",percentVar[2],"% variance")) + 
+   coord_fixed()
> pcaData <- plotPCA(vsd, intgroup=c("Bacth_no"), returnData=TRUE)
> percentVar <- round(100 * attr(pcaData, "percentVar"))
> ggplot(pcaData, aes(PC1, PC2, color=Bacth_no)) +
+   geom_point(size=3) +
+   xlab(paste0("PC1: ",percentVar[1],"% variance")) +
+   ylab(paste0("PC2: ",percentVar[2],"% variance")) + 
+   coord_fixed()
>

I have plotted PCA for different things in my colData

The number of batches we collected the data before using housekeeping genes enter image description here

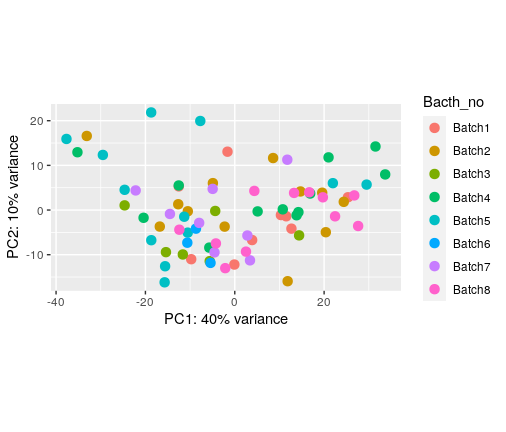
The number of batches we collected the data after using housekeeping genes (control genes)

enter image description here

And the other features (my main interest in Status_2 thought)

enter image description here

enter image description here

enter image description here

enter image description here Please, do you think if I should do batch correction for these eight batches or what else?

ADD REPLY

Login before adding your answer.

Traffic: 615 users visited in the last hour
Help About
FAQ
Access RSS
API
Stats

Use of this site constitutes acceptance of our User Agreement and Privacy Policy.

Powered by the version 2.3.6