
Hey everyone,
I was hoping someone can help me with this:
I am currently doing QC analysis of my RNA-seq data which was done in a controlled cell-line (knockdown experiment) and I’m interested in analysing it at the gene and transcript level.
I used Salmon in selective alignment mode with 50 bootstraps and imported the data using tximeta and performed an initial PCA analysis on filtered genes and transcripts using the abundance estimate.
While my samples are clustering really well at the gene level, one particular sample clusters away from the rest of its group on PC2 at transcript level.
I looked at transcript length and GC content, library size, and nothing seems to correlate with it.
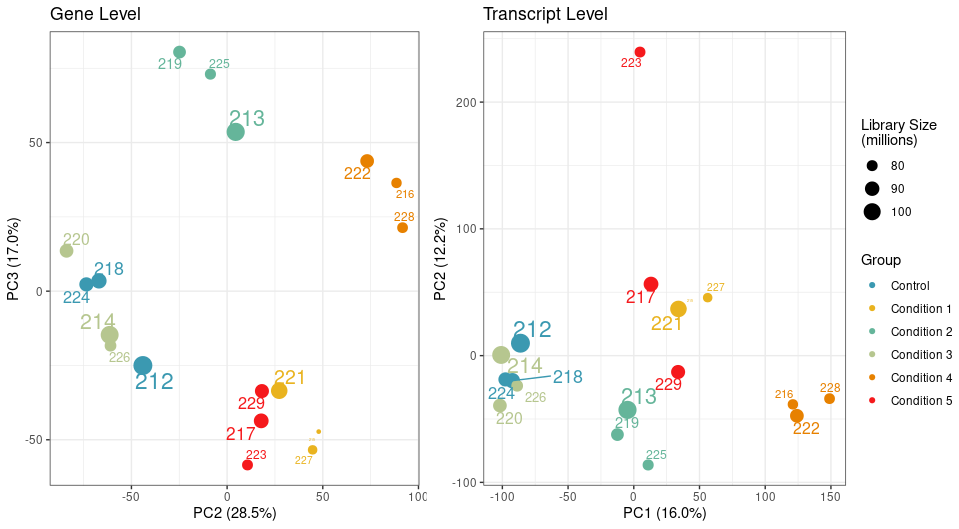
We have a filtering criteria in my lab where for each sample, we calculate its mean correlation to all other samples and remove samples whose mean correlation is 3 standard deviations below the mean correlation. By this measure, the sample 223 passes the filtering threshold at the gene level, but not the transcript.
If I remove it, I would end up with an n= 2 for this condition for transcript level analysis. Is it worth applying cqn or RUVSeq at the transcript level for this analysis?

Is this paired end sequencing data? If so, have you looked at the insert size for each sample?
This article mentions insert size as one of the biggest sources of variation for transcript level counts from paired end short-read sequencing data.
Agree, and it will show up if you run Salmon -> MultiQC. I often look at this plot to figure out residual variation.
Thanks so much for this. This is paired end data.
Are you referring to the fragment length distribution plot?
Just ran multiqc and this is the output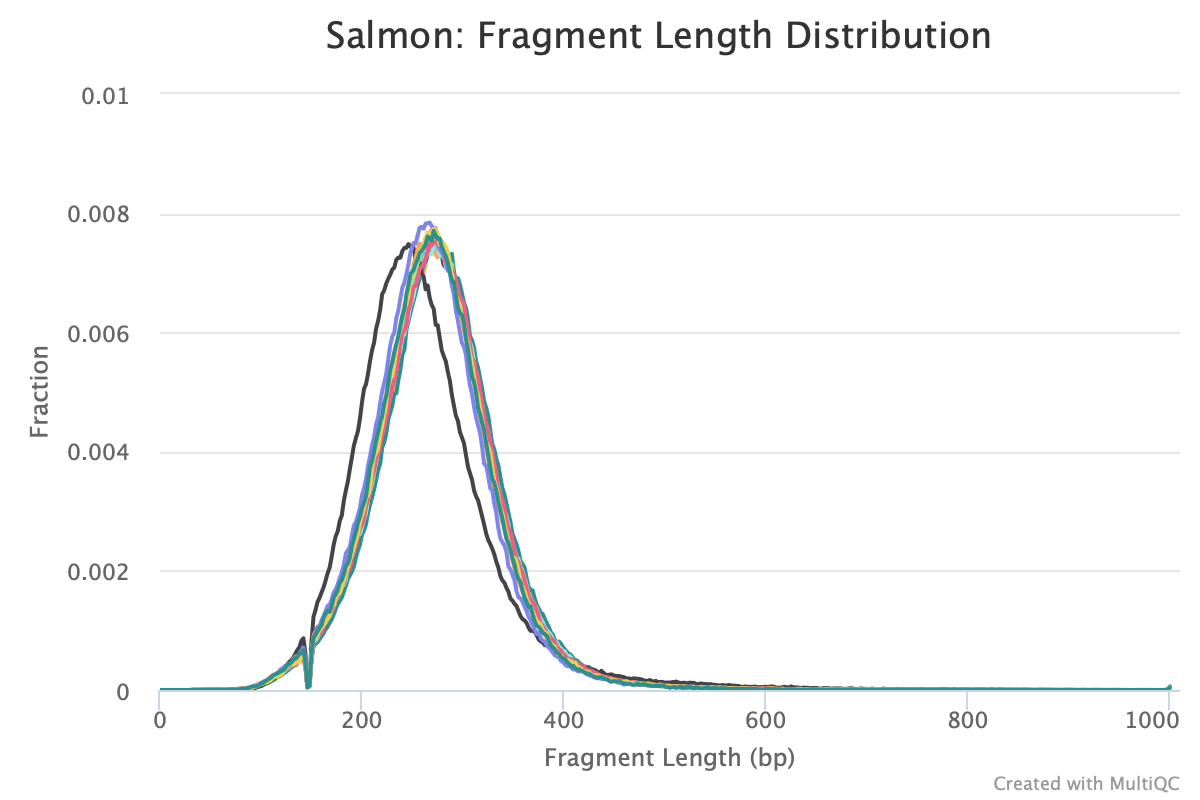
The sample that is shifted slightly to the left is sample 223. How would I account for this downstream?
Salmon tries to correct for this in the transcript abundance estimates.
Can you try an experiment: perform PCA on the log of the abundances you have in the tximeta output.
Hi Michael,
The PCA attached above in the question was generated using abundances, unless you mean something else?
This is my code
What about:
I don't like scale=TRUE (this is the point of the VST, to put the features on a homoskedastic scale, but without inflating noise). Also TPM of 1e-6 is really tiny, and the log of that can inflate noise.
Yep, just tried it with this being the result. Looks like the variation of this sample is now coming from PC1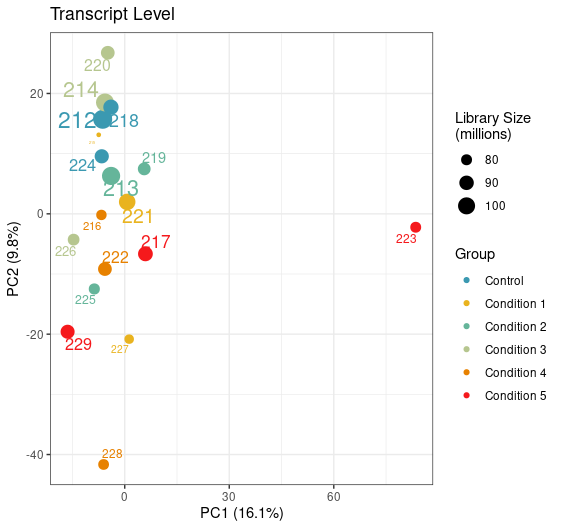
Another QC step: coverage of the transcript?
One choice is:
https://multiqc.info/modules/rseqc/
Just had a question. How would I run RSeQC after Salmon quantification, or would I need to generate a BAM some other way?
I also wanted to know what would be the implication of transcript coverage? I'm looking to do a differential transcript expression analysis using Swish given that it's a simple pairwise comparison of conditions against Control. Would I need to use a differential normalisation?
Ah, yes good point, you'd have to align the reads (at least for 223, maybe also 229, 217 for comparison), to look at transcript coverage plots. With HISAT or STAR usually only takes a few minutes.
I'm just wondering if something about the library construction of this sample is different such that you wouldn't want to include it in the transcript level analysis.
Safest would be to exclude it, but you lose power. Will you be performing 3 vs 3 comparisons? You may want to use the catchSalmon methods in edgeR, which are better powered for 3 vs 3, compared to Swish:
different number of DEG because of outliers
You could probably get away with 2 vs 3 using the parametric model in edgeR with catchSalmon to weight by uncertainty.