I am currently studying on some data set and need to identify differentially expressed genes between two tissues : kidney and liver. I have 7 samples, 4 for kidney and 3 for liver encoded in rawdata that is a formal class AffyBatch. The variable design is a 7x2 matrix where the first column is an indicator for kidney (1 1 1 1 0 0 0) and the second one is an indicator of liver (0 0 0 0 1 1 1). Then I use lmFit and eBayes to perform a statistical analysis.
data <- affy::rma(rawdata)
eset <- exprs(data)
fit <- lmFit(eset, design)
fit <- eBayes(fit)
Now I want to present a volcano plot of M (log2 fold change) vs the B-statistic. I believe that they are respectively contained in fit$coefficients[,2] and fit$lods[,2].
M <- fit$coefficients[,2]
B <- fit$lods[,2]
However, the resulting plot, after running plot(M,B,pch="."), does not look like a classical volcano plot at all.
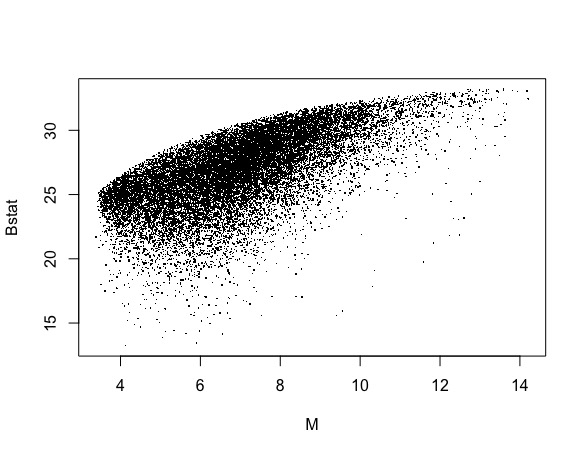
I noticed that the M column I was dealing with had no notion of symmetry so of course no volcano structure will appear in the plot. Am I doing something wrong ?
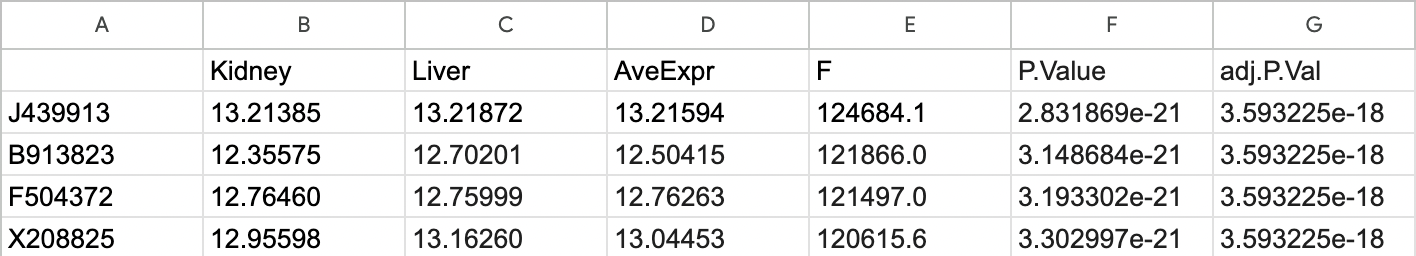
Here is the output of topTable(fit, n = 4) if it can be useful