
I'm analyzing a smart-seq dataset with samples from 9 different people with 4 runs and 17 plates. The samples were first treated and then sorted after stimulated with another condition, later were filtered in flow cytometry and then plated. In total, there are 14 different conditions.
I'm following the OSCA guidelines and I found scran::testLinearModel to make comparisons while providing a design that would allow to block or control for other variables.
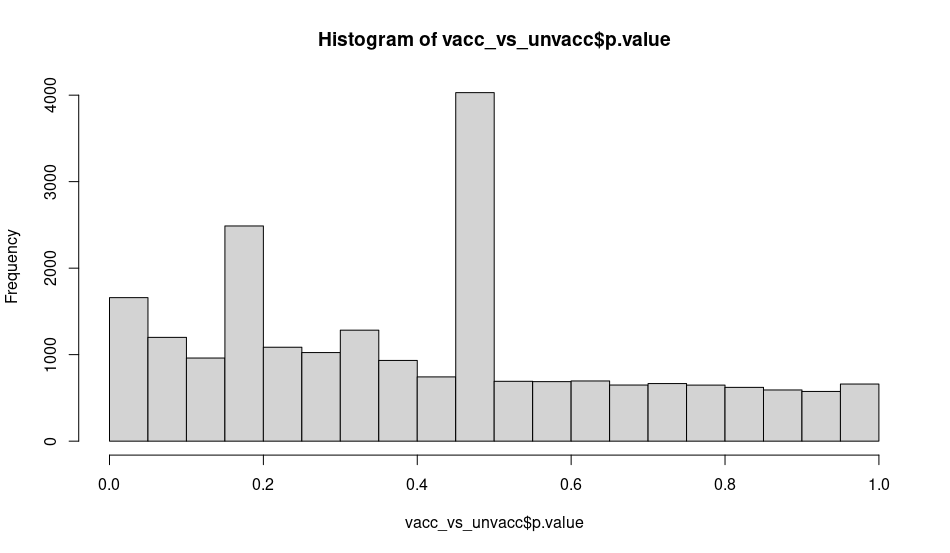
I was checking the output of the histogram of the p-values of a comparison (without blocking or controlling just ~vaccination) and I am surprised by some cells having very similar p-value at specific ranges: around 0.16 and close to 0.46:
While the experiment wasn't designed for scRNA-seq it is the first time analyzing Smart-seq2 data and I'm not sure if I missed any step or why could this be happening. Is this normal/expected (due to normalization effects sequencing depth or other know scRNA-seq procedure) or there is something wrong I can address?
The dataset was filtered by % of mitochondrial percentage, number of reads and number of features and later normalized via scuttle::logNormCounts.
The total number of cells after filtering is low ~1135 and while the 1st PCA showed a low % of variance (3%) I didn't observe much batch effect and if any it was at the second dimension (2%).

The work from Charlotte Soneson (https://pubmed.ncbi.nlm.nih.gov/29481549/) points out that for scRNA-seq a good prefiltering improves DE reliability using frameworks like limma (not unexpected, but good they show it formally). When I compare two groups on single-cell level it (for me) works well to require a certain CPM per gene in at least x% of cells. For example, at least one of two groups must express a gene with a CPM (
scuttle::calculateCPM) of 1 in > 25% of cells. MA-plots look much more reasonable after such a filter (and utterly violent without it) and it removes genes called as DE due to few outliers while the vast majority of cells has zeros for that gene. Might help here as well.Yes, I thought about this, but I thought it would show up as just one bump not two. I had already filtered out many genes lowly expressed (the plot is made with 21k genes), but it seems I'll need to be more restrictive. The suggested threshold "1 in > 25% of cells" applied to both groups only removes 617 more genes (Smart-seq2 has up to 96 cells per plate and thus the sequencing depth is quite high). Thanks both!