
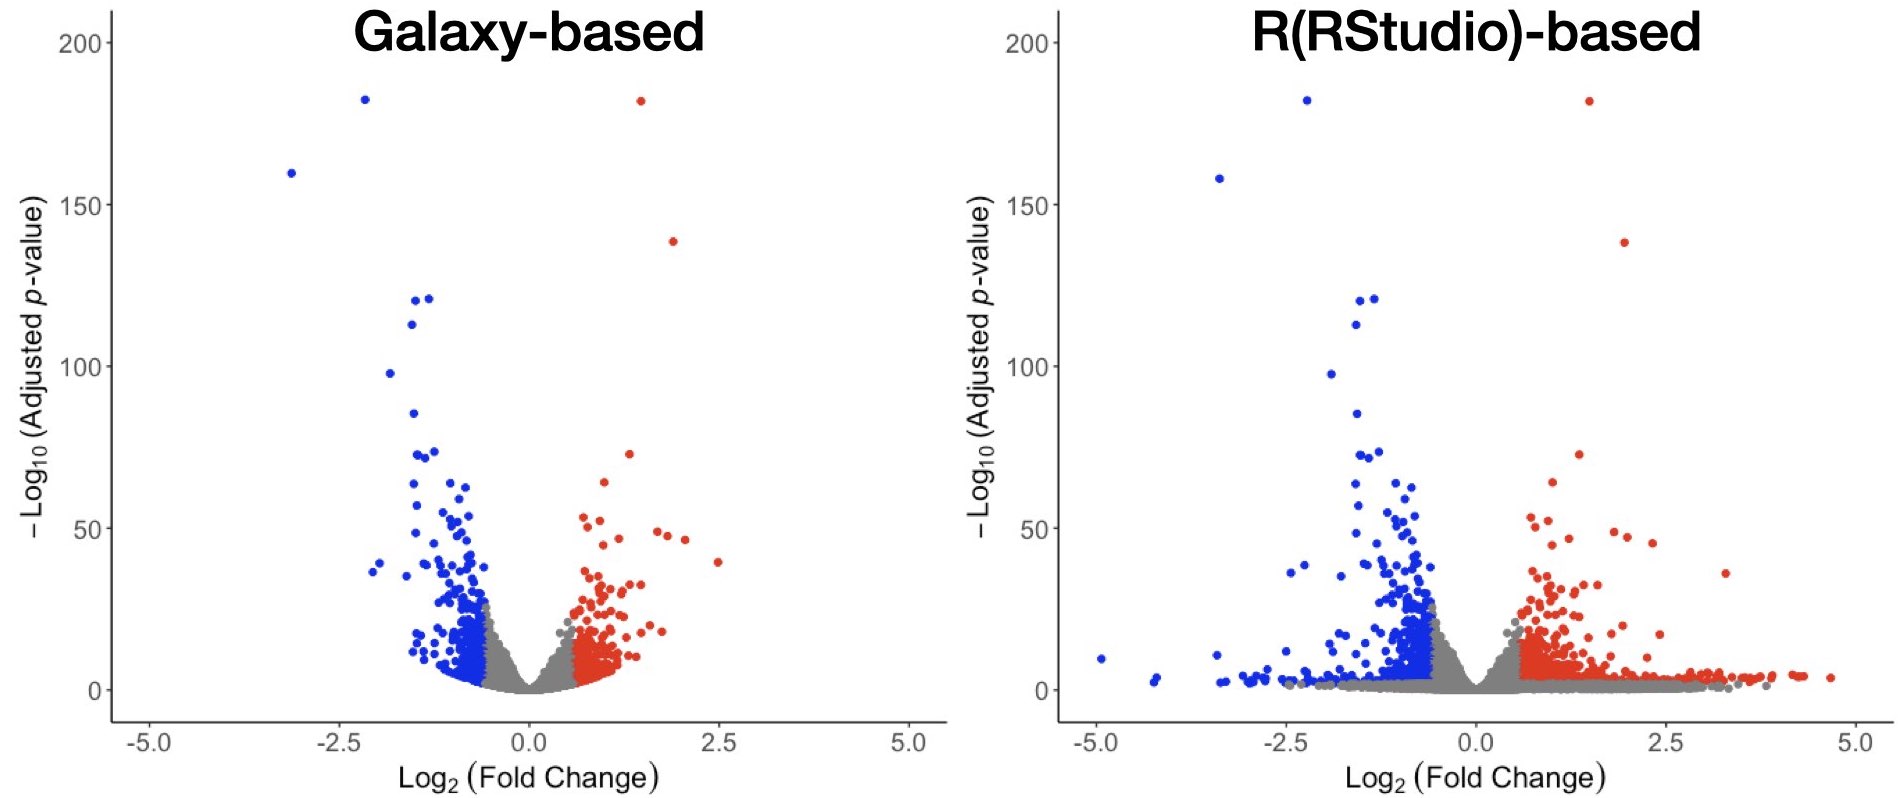
Recently, I reanalyzed some gene expression data using DESeq2. To my surprise, the resulting volcano plots looked quite different from the previous analysis. During the troubleshooting phase of the analysis, I realized that the data was previously generated using a Galaxy-based version of DESeq2 v 1.34.0 and I used version 1.40.1 in RStudio (see below).
Close inspection of the results files showed that the calculation of the log2FoldChange was the major reason for the discrepancy. I am including (see below) as an example, information about gene A. I am also including the raw numbers for the gene, the normalized counts coming from the dds object (RStudio), and the VST normalized counts for both Galaxy and RStudio files.
1) Would you please comment which fold change will be closer to reality?
2) Why am I getting such a discrepancy in the log2FoldChange between the analyses?
Thank you for your help!
Platform    baseMean    Log2FoldChange  lfcSE       stat        pvalue      padj
Galaxy      17.102747   -0.44276    0.15465304  -2.86295    0.004197    0.0227
Rstudio     17.1026     -5.92047    1.49447     -3.961587   7.45E-05    0.000820

Samples             CntRNA-1    CntRNA-2    CntRNA-3    KORNA-1 KORNA-2 KORNA-3
Raw counts          1       78      6       1   0   1
Normalizeddds-RStudio       1.120692    92.55239    7.274768    0.68380 0   0.983963
VST-Counts-RStudio      9.446782    9.920987    9.538052    9.43386 9.3877  9.443066
VST-Counts-Galaxy       7.477439    8.417805    7.661466    7.45136 7.3582  7.469936

Hello @peTTU- did you ever determine what was causing this discrepancy between using DeSeq2 in R/R Studio and Galaxy? I am seeing a similar result as well.
I used the apeglm method for lfcShrink in R/Rstudio (according to the vignette) and filtered out a large number of rows with low counts. However, based on the output below it looks like Galaxy has filtered out 25% of the rows because of low counts too. Perhaps this is why the volcano plots looks so different? However, this looks like it might have occurred not during the pre-filtering step but in the independent filtering of the results.
I've already used the code suggested below but perhaps I should increase the group size to 6 or 7 since I have a total of 13 samples?
I also looked into the code that it seems like Galaxy is running. I've copied a portion of that below:
the code then continues (at the ...) with multiple file names (I'm guessing the featureCounts inputs).
Also the output looks like:
So I'm sort of guessing that perhaps my sample might have a large number of samples where there is <2 counts and this is causing the difference in the volcano plots? Any other ideas would be very helpful. thanks in advance!
I may have figured out a little part of this problem... when I output the data into a .csv I used the code below:
instead I probably should have used something like:
where resLFC was the updated dds object after applying the LFC shrinkage.
One more comment - I think I have this figured out now (at least as far as the differences in the volcano plot go, which should reflect the log2FC as well, I think).
The volcano plot generated from the data from Galaxy uses
shrinkLFC(type = 'normal').When I saved a .csv file from R/R Studio using what I guess was the original normal distribution to shrink the LFC estimates and then used those LFC estimates to create a volcano plot I got something very similar to what Galaxy gave, so I'm guessing that the Galaxy server probably uses that method.
When I used
shrinkLFC(type = 'apeglm')and then output the data into a .csv as I mentioned in my comment immediately above, I got something that looked like so:So there are fewer (none?) values on the x-axis, compared to the original plot you posted from R/R Studio.