
Hey Devs,
Thanks for the package and it's upkeep. I've hit a snag comparing two conditions (A=6 samples, B=9 samples), wherein feature counts in A = 0 or 1, counts in B =100 - 15,000, but the logFC and p-values are NA/NaN's. +samples typically are all of one group, 1-0 of the other.
I would expect 1:15000 to be a significant signal, and can only think of one thing, the paragraph in the metagenome.pdf, which states
_"Warning: The user should restrict significant features to those with a minimum number of positive samples. What this means is that one should not claim features are significant unless the effective number of samples is above a particular percentage. For example, fold-change estimates might be unreliable if an entire group does not have a positive count for the feature in question."_
is this what I'm seeing with this data? Can produce MRE at a later point if necessary.
Thanks for the assist
example:
NA |
+samples in group 0 |
+samples in group 1 |
counts in group 0 |
counts in group 1 |
logFC |
se |
pvalues |
adjPvalues |
AB669249 |
1 |
7 |
1 |
15584 |
NA |
NA |
NaN |
NaN |
JN052751. |
0 |
9 |
0 |
4443 |
NA |
NA |
NaN |
NaN |
AB2745058 |
1 |
8 |
1 |
4311 |
NA |
NA |
NaN |
NaN |
AB274517 |
0 |
9 |
0 |
2881 |
NA |
NA |
NaN |
NaN |
CU918909 |
0 |
6 |
0 |
2643 |
NA |
NA |
NaN |
NaN |
FN56316 |
0 |
9 |
0 |
2240 |
NA |
NA |
NaN |
NaN |
CU92752 |
0 |
8 |
0 |
2023 |
NA |
NA |
NaN |
NaN |
KM67594 |
0 |
9 |
0 |
1645 |
NA |
NA |
NaN |
NaN |
AJ50619 |
1 |
9 |
1 |
1262 |
NA |
NA |
NaN |
NaN |
CU9189 |
0 |
6 |
0 |
1236 |
NA |
NA |
NaN |
NaN |

Hey,
Below is the code: sIE_Stable_mod <- model.matrix(~1+ Group, data = pData(sIEStable_meta_filt_css)) sIE_Stable_res1 <- fitFeatureModel(sIEStable_meta_filt_css, sIE_Stable_mod) sIE_Stable_res1_coef<-MRcoefs(sIE_Stable_res1,number=nrow(MRcounts(sIEStable_meta_filt_css)))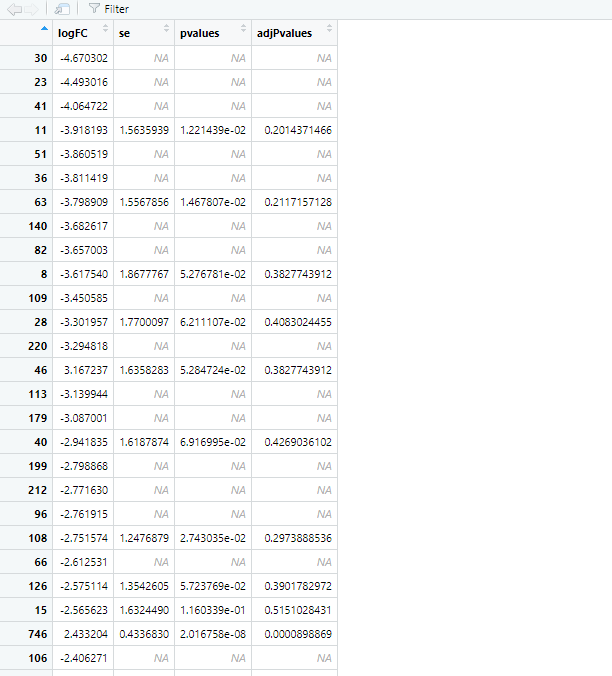
Can i use the results directly or something goes wrong?
Many thanks