
Hi!
I am currently playing with different contrast coding strategies in R - especially in DESeq2.
As part of that, I was producing the same DGE analysis using two different contrast coding strategies: (1) using the what is called simplest case for contrasts in the DESeq2::results() help file, and (2) using what is called the most general case.
While I was expecting identical results, I saw a minor fraction of genes with differences.
These differences are in four columns of the results output: (1) log2FoldChange, (2) stat, (3) pvalue, and (4) padj.
Does anyone know why this is the case?
For now, I am skipping the original code part for this example, since it is a rather long script. And again: splitting point of the two different outputs is the DESeq2::results() function, supplying different contrast codings. So based on the fact that more than 17,200 genes are completely identical between the two outputs, I am rather certain that there is no coding issue.
But I am happy to expand on the coding part - of course.
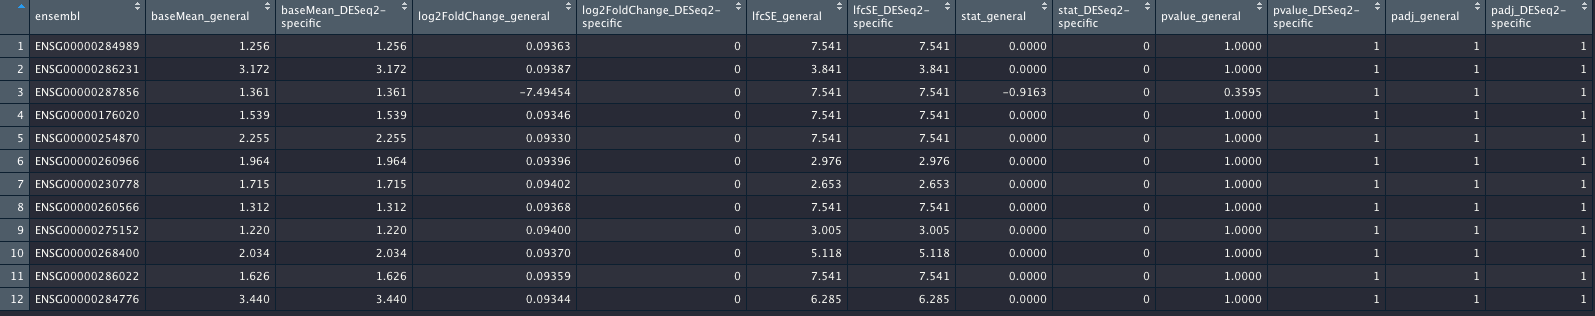
I did attach an image of the genes (again, out of more than 17,200 genes) which will show the genes with differences. I hope the columns are self-explanatory.
_general columns refer to the most general case; _DESeq2-specific columns refer to the contrast coding using the c(factor, numerator, denominator) style.
EDIT OF POST: ADDITION OF CODE
As mentioned in the original post above, the splitting point into the two different outputs is the DESeq2::results().
model_formula <- stats::formula(
  x = ~ 1 + donor_id + treatment
)

model_matrix <- stats::model.matrix(
  object = model_formula,
  data = SummarizedExperiment::colData(x = dds)
)

DESeq2::design(object = dds) <- model_formula

dds_estimate_size_factors <- DESeq2::estimateSizeFactors(
  object = dds
)

dds_estimate_dispersions <- DESeq2::estimateDispersions(
  object = dds_estimate_size_factors
)

dds_nbinom_wald_test <- DESeq2::nbinomWaldTest(
  object = dds_estimate_dispersions
)

model_contrasts <- limma::makeContrasts(
  treatment_A_effect =
    treatment_A,
  levels = model_matrix
)

dds_res_1 <- DESeq2::results(
    object = dds_nbinom_wald_test,
    contrast = model_contrasts,
    lfcThreshold = params$lfc_threshold_stats,
    altHypothesis = "greaterAbs",
    independentFiltering = TRUE,
    alpha = 0.1,
    pAdjustMethod = "BH",
    format = "DataFrame",
    tidy = TRUE
  )

tmp_contrasts <- base::list(
  treatment_A_effect = c("treatment", "A", "B")

dds_res_2 <- DESeq2::results(
    object = dds_nbinom_wald_test,
    contrast = tmp_contrasts,
    lfcThreshold = params$lfc_threshold_stats,
    altHypothesis = "greaterAbs",
    independentFiltering = TRUE,
    alpha = 0.1,
    pAdjustMethod = "BH",
    format = "DataFrame",
    tidy = TRUE
  )
)
The result of this code are two tables das_res_1 and dds_res_2, where 17,293 genes are completely identical in terms of their log2FC, p-values etc, and 12 genes are not. This is shown in the image of this post. I did not show the code for making the data frame shown in the image, but this was basic re-arranging the columns using tidyr.
BTW: Treatment "B" is the reference level in the model.
I hope the code addition helps!
Thanks much everybody!!

You should add code to explain what you did rather than just text. Right now it is basically irreproducible.
Sure... as mentioned, I can add the code.
I will edit the original post.
Best, Ben
Okay... Code is added now. Let me know if you have any other questions regarding the code.