Hello! I did a differential expression analysis with edgeR using TCGAbiolinks on the TCGA dataset of hepatocellular carcinoma. I then took the columns of GeneID and logFC, converted the GeneID into Entrez, and ran it through the pathview function of the homonymous package to visualize the epithelial-mesenchymal transition pathway. I had previously checked in the dataset whether the gene SNAI2 appeared, as it's one that I'm particularly interested in, and it was indeed differentially expressed. However, the SNAI2-coded protein appeared as blank on the image of the pathway that I obtained after running the code. Any ideas on why this could be happening? I thought that if the gene appeared on the dataset then the gene-coded protein should appear colored on the pathview image.
#DEedgeR is the name of my dataset with the Entrez genes and the logFC
gdata= DEedgeR[,2]
names(gdata)= as.character(DEedgeR[,1])

map04520 <- pathview(gene.data  = gdata,
                     pathway.id = "hsa04520",
                     species = "hsa",
                     limit = list(gene=as.integer(max(abs(gdata)))))


sessionInfo( )
R version 4.0.3 (2020-10-10)
Platform: x86_64-w64-mingw32/x64 (64-bit)
Running under: Windows 10 x64 (build 18363)

Matrix products: default

locale:
[1] LC_COLLATE=Spanish_Argentina.1252  LC_CTYPE=Spanish_Argentina.1252
[3] LC_MONETARY=Spanish_Argentina.1252 LC_NUMERIC=C
[5] LC_TIME=Spanish_Argentina.1252

attached base packages:
[1] parallel  stats4    stats     graphics  grDevices utils     datasets  methods   base

other attached packages:
 [1] pathview_1.30.0        DO.db_2.9              KEGG.db_3.2.4          KEGGprofile_1.32.0
 [5] org.Hs.eg.db_3.12.0    AnnotationDbi_1.52.0   IRanges_2.24.0         S4Vectors_0.28.0
 [9] Biobase_2.50.0         BiocGenerics_0.36.0    clusterProfiler_3.18.0 TCGAbiolinks_2.18.0
[13] BiocManager_1.30.10    ggthemes_4.2.0         survival_3.2-7         survminer_0.4.8
[17] ggpubr_0.4.0           ggplot2_3.3.2          xlsx_0.6.5             tidyr_1.1.2
[21] readxl_1.3.1           dplyr_1.0.2

loaded via a namespace (and not attached):
  [1] shadowtext_0.0.7            backports_1.2.0             fastmatch_1.1-0
  [4] BiocFileCache_1.14.0        plyr_1.8.6                  igraph_1.2.6
  [7] splines_4.0.3               BiocParallel_1.24.1         GenomeInfoDb_1.26.1
 [10] digest_0.6.27               GOSemSim_2.16.1             viridis_0.5.1
 [13] GO.db_3.12.1                magrittr_2.0.1              memoise_1.1.0
 [16] openxlsx_4.2.3              Biostrings_2.58.0           readr_1.4.0
 [19] graphlayouts_0.7.1          matrixStats_0.57.0          R.utils_2.10.1
 [22] askpass_1.1                 enrichplot_1.10.1           prettyunits_1.1.1
 [25] colorspace_2.0-0            blob_1.2.1                  rvest_0.3.6
 [28] rappdirs_0.3.1              ggrepel_0.8.2               haven_2.3.1
 [31] xfun_0.19                   crayon_1.3.4                RCurl_1.98-1.2
 [34] jsonlite_1.7.1              graph_1.68.0                scatterpie_0.1.5
 [37] zoo_1.8-8                   glue_1.4.2                  polyclip_1.10-0
 [40] gtable_0.3.0                zlibbioc_1.36.0             XVector_0.30.0
 [43] DelayedArray_0.16.0         car_3.0-10                  Rgraphviz_2.34.0
 [46] abind_1.4-5                 scales_1.1.1                DOSE_3.16.0
 [49] DBI_1.1.0                   rstatix_0.6.0               Rcpp_1.0.5
 [52] viridisLite_0.3.0           xtable_1.8-4                progress_1.2.2
 [55] foreign_0.8-80              bit_4.0.4                   km.ci_0.5-2
 [58] httr_1.4.2                  fgsea_1.16.0                RColorBrewer_1.1-2
 [61] ellipsis_0.3.1              pkgconfig_2.0.3             XML_3.99-0.5
 [64] rJava_0.9-13                R.methodsS3_1.8.1           farver_2.0.3
 [67] dbplyr_2.0.0                tidyselect_1.1.0            rlang_0.4.8
 [70] reshape2_1.4.4              TeachingDemos_2.12          munsell_0.5.0
 [73] cellranger_1.1.0            tools_4.0.3                 downloader_0.4
 [76] generics_0.1.0              RSQLite_2.2.1               broom_0.7.2
 [79] stringr_1.4.0               knitr_1.30                  bit64_4.0.5
 [82] tidygraph_1.2.0             zip_2.1.1                   survMisc_0.5.5
 [85] purrr_0.3.4                 KEGGREST_1.30.0             ggraph_2.0.4
 [88] R.oo_1.24.0                 KEGGgraph_1.50.0            xml2_1.3.2
 [91] biomaRt_2.46.0              compiler_4.0.3              rstudioapi_0.13
 [94] png_0.1-7                   curl_4.3                    ggsignif_0.6.0
 [97] tibble_3.0.4                tweenr_1.0.1                stringi_1.5.3
[100] TCGAbiolinksGUI.data_1.10.0 forcats_0.5.0               lattice_0.20-41
[103] Matrix_1.2-18               KMsurv_0.1-5                vctrs_0.3.5
[106] pillar_1.4.7                lifecycle_0.2.0             data.table_1.13.2
[109] cowplot_1.1.0               bitops_1.0-6                GenomicRanges_1.42.0
[112] qvalue_2.22.0               R6_2.5.0                    gridExtra_2.3
[115] rio_0.5.16                  MASS_7.3-53                 assertthat_0.2.1
[118] SummarizedExperiment_1.20.0 xlsxjars_0.6.1              openssl_1.4.3
[121] withr_2.3.0                 GenomeInfoDbData_1.2.4      hms_0.5.3
[124] grid_4.0.3                  rvcheck_0.1.8               MatrixGenerics_1.2.0
[127] carData_3.0-4               ggforce_0.3.2               tinytex_0.27
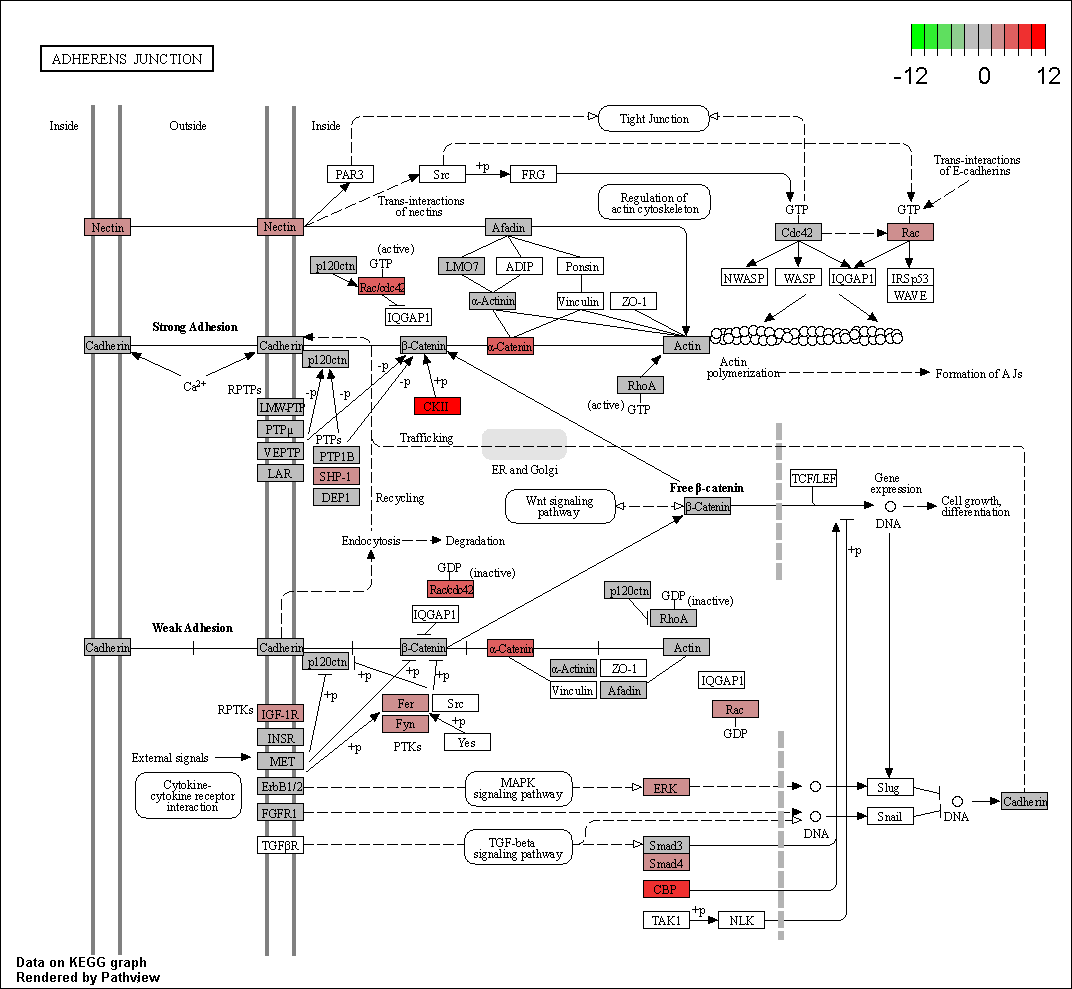
Here's the pathway image that I obtained. The protein coded by my gene of interest (Slug) appears on the bottom right of the image.
Sorry if the question is too dumb or makes no sense, I'm new to Bioconductor. I'm open to any suggestions.