Entering edit mode

Marissa
•
0
@marissa-24334
Last seen 3.4 years ago
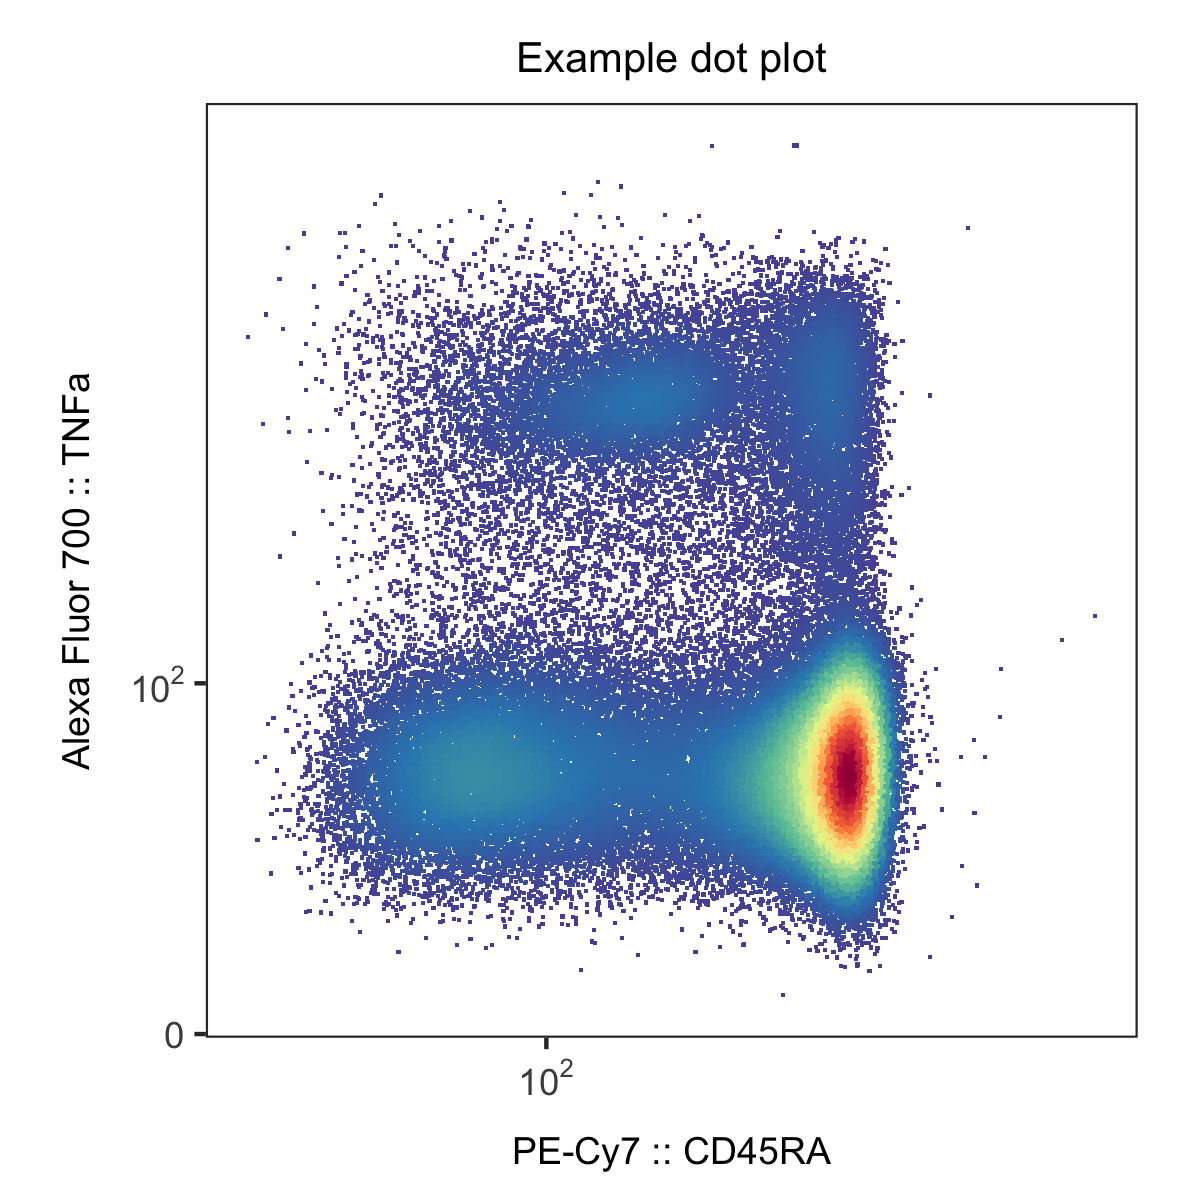
Hi! I am working on developing some flow cytometry dot plots for publication and am a fan of making them using ggcyto. However, I need to add tick marks and a better scale for my current plots because they are sorely lacking under the default setting of scale_x_flowjo_biexp. Does anyone know how to change the limits and breaks and add a nicer scale (say with 10^3, 10^4, etc) to the x and y axes?
library(ggcyto)
library(viridis)
library(CytoML)
library(RColorBrewer)
library(colorspace)

ws <- open_flowjo_xml("Figure 23.wsp")
gs <- flowjo_to_gatingset(ws, name = "R")
plot(gs)

attr(gs, "subset") <- "CD8+"
df <- fortify(gs)

cols <- rev(brewer.pal(10, "Spectral"))

df$d <- densCols(df[,`Comp-PE-Cy7-A`], df[,`Comp-Alexa Fluor 700-A`],
                 colramp = colorRampPalette(cols))

ggplot(df, aes(x = `Comp-PE-Cy7-A`, y = `Comp-Alexa Fluor 700-A`)) +
  geom_point(aes(color = d), shape = '.') +
  scale_color_identity() +
  theme_mf() +
  scale_x_flowjo_biexp() +
  scale_y_flowjo_biexp(widthBasis = -100) +
  labs(title = "Flow Cytometry Color Dot Plot #1",
       subtitle = "Color Palette = 'Reverse Spectral'",
       x = "PE-Cy7 :: CD45RA",
       y = "Alexa Fluor 700 :: TNFa")

BTW, the data within gs parsed from flowjo_to_gatingset is typically already biexp scale, I wonder if you need/should add extra scale_*_flowjo_biexp layers?