Entering edit mode

saw44
•
0
@43dd254e
Last seen 3.3 years ago
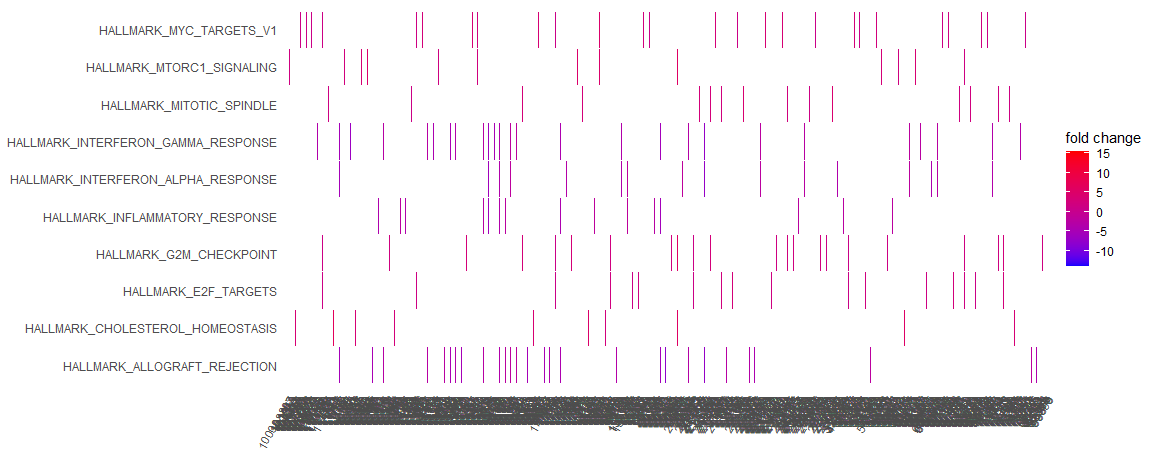
I've created a heatplot using enrichPlot, from GSEA results obtained by clusterProfiler. However, it's plotted a lot of genes on the x axis and it's far too busy (pictured). Is there a way to cut down the amount of genes plotted to make the graph more readable? Thanks for your time!
GSEA_results <- GSEA(ranked_gene_list,
                         TERM2GENE = m_t2g)

heatplot(GSEA_results,
         showCategory = 10,
         foldChange = ranked_gene_list)
sessionInfo( )
R version 4.0.1 (2020-06-06)
Platform: x86_64-w64-mingw32/x64 (64-bit)
Running under: Windows 10 x64 (build 18363)

Matrix products: default

locale:
[1] LC_COLLATE=English_United Kingdom.1252  LC_CTYPE=English_United Kingdom.1252
[3] LC_MONETARY=English_United Kingdom.1252 LC_NUMERIC=C
[5] LC_TIME=English_United Kingdom.1252

attached base packages:
[1] stats     graphics  grDevices utils     datasets  methods   base

other attached packages:
 [1] DOSE_3.14.0            enrichplot_1.8.1       pathview_1.28.1
 [4] forcats_0.5.0          stringr_1.4.0          dplyr_1.0.2
 [7] purrr_0.3.4            readr_1.4.0            tidyr_1.1.2
[10] tibble_3.0.3           ggplot2_3.3.2          tidyverse_1.3.0
[13] clusterProfiler_3.16.1 limma_3.44.3           biomaRt_2.44.4

loaded via a namespace (and not attached):
  [1] snow_0.4-3                  readxl_1.3.1                backports_1.1.10
  [4] fastmatch_1.1-0             BiocFileCache_1.12.1        plyr_1.8.6
  [7] igraph_1.2.6                splines_4.0.1               BiocParallel_1.22.0
 [10] GenomeInfoDb_1.24.2         urltools_1.7.3              digest_0.6.25
 [13] htmltools_0.5.0             GOSemSim_2.14.2             viridis_0.5.1
 [16] GO.db_3.11.4                fansi_0.4.1                 magrittr_1.5
 [19] memoise_1.1.0               Biostrings_2.56.0           annotate_1.66.0
 [22] graphlayouts_0.7.1          modelr_0.1.8                matrixStats_0.57.0
 [25] askpass_1.1                 prettyunits_1.1.1           colorspace_1.4-1
 [28] blob_1.2.1                  rvest_0.3.6                 rappdirs_0.3.1
 [31] ggrepel_0.8.2               haven_2.3.1                 xfun_0.18
 [34] crayon_1.3.4                RCurl_1.98-1.2              jsonlite_1.7.1
 [37] org.Mm.eg.db_3.11.4         graph_1.66.0                scatterpie_0.1.5
 [40] genefilter_1.70.0           survival_3.1-12             glue_1.4.2
 [43] polyclip_1.10-0             gtable_0.3.0                zlibbioc_1.34.0
 [46] XVector_0.28.0              DelayedArray_0.14.1         Rgraphviz_2.32.0
 [49] BiocGenerics_0.34.0         scales_1.1.1                DBI_1.1.0
 [52] Rcpp_1.0.5                  viridisLite_0.3.0           xtable_1.8-4
 [55] progress_1.2.2              gridGraphics_0.5-0          bit_4.0.4
 [58] europepmc_0.4               stats4_4.0.1                DT_0.16
 [61] htmlwidgets_1.5.2           httr_1.4.2                  fgsea_1.14.0
 [64] RColorBrewer_1.1-2          ellipsis_0.3.1              pkgconfig_2.0.3
 [67] XML_3.99-0.5                farver_2.0.3                dbplyr_1.4.4
 [70] locfit_1.5-9.4              ggplotify_0.0.5             tidyselect_1.1.0
 [73] labeling_0.4.2              rlang_0.4.7                 reshape2_1.4.4
 [76] AnnotationDbi_1.50.3        munsell_0.5.0               cellranger_1.1.0
 [79] tools_4.0.1                 downloader_0.4              cli_2.1.0
 [82] generics_0.0.2              RSQLite_2.2.1               broom_0.7.2
 [85] ggridges_0.5.2              org.Hs.eg.db_3.11.4         bit64_4.0.5
 [88] fs_1.5.0                    tidygraph_1.2.0             KEGGREST_1.28.0
 [91] ggraph_2.0.3                KEGGgraph_1.48.0            DO.db_2.9
 [94] xml2_1.3.2                  compiler_4.0.1              rstudioapi_0.11
 [97] png_0.1-7                   curl_4.3                    reprex_0.3.0
[100] tweenr_1.0.1                geneplotter_1.66.0          stringi_1.5.3
[103] lattice_0.20-41             Matrix_1.2-18               vctrs_0.3.4
[106] pillar_1.4.6                lifecycle_0.2.0             BiocManager_1.30.10
[109] triebeard_0.3.0             data.table_1.13.0           cowplot_1.1.0
[112] bitops_1.0-6                GenomicRanges_1.40.0        qvalue_2.20.0
[115] R6_2.5.0                    gridExtra_2.3               IRanges_2.22.2
[118] MASS_7.3-51.6               assertthat_0.2.1            SummarizedExperiment_1.18.2
[121] openssl_1.4.3               DESeq2_1.28.1               withr_2.3.0
[124] S4Vectors_0.26.1            GenomeInfoDbData_1.2.3      parallel_4.0.1
[127] hms_0.5.3                   grid_4.0.1                  rvcheck_0.1.8
[130] ggforce_0.3.2               Biobase_2.48.0              lubridate_1.7.9
[133] tinytex_0.26
from what I've seen here and here, the enrichment analysis is performed on the list of genes of interest that you'd like to display, so that you can then show only those in the heatmap. I hope that helps!