Entering edit mode

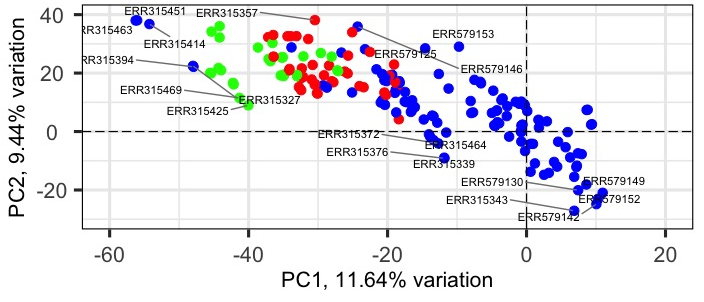
I explore expression data from multiple tissues grouped into three sets (colored red, green, and blue). How to use ellipse for only 1, 2 or subset of tissues based on metadata (columns "set", "tissue"). I succeed to ellipse e.g. a whole set1 or set2 but I need to preserve colors of sets but ellipse just selected tissue(s). The tissues belong to the same set or different ones.
pcaData <- pca(txcount, metadata = designexp)
biplot(pcaData,
       colby = "set",
       colkey = c("set1" = "blue","set2" = "green","set3" = "red"),
       # ellipse config
       ellipse = TRUE,
       ellipseConf = 0.95,
       ellipseFill = TRUE,
       ellipseAlpha = 1/4,
       ellipseLineSize = 0,
       ellipseFillKey = c("tissue1"="#FEE5D9","tissue5"="#99000D"),
       xlim = c(-60,20), ylim = c(-30,40),
       hline = 0, vline = 0,
       legendPosition = 'right')
sessionInfo( )
R version 4.0.2 (2020-06-22)
Platform: x86_64-apple-darwin17.0 (64-bit)
Running under: macOS  10.16

OK, I understand. That's why I failed at all my attempts to this task. I believe such visualization will solve my scientific problem so I am pretty much fixed to it. I am not fluent with R, so could you give me a hint for two other scenarios for that task: (1) the data contains biological replicates. In order to reduce number of dots at biplot I could average the biological replicates of the same tissue into one. At what stage should I do this? Raw expression data, normalized expression data or on principal components? ...and how? (2) generate two separate biplots and overlap them. One the oryginal with all the dots, and the other with subset of data (e.g. only ellipses visible). How to overlap two plots and how to extract subset from PCA object?
Could you possibly help me with that?
Best regards, Marcin
I have not seen other users doing this. I would only average across technical replicates, not biological replicates.
Why not generate 2 plots side-by-side?
2 plots side-by-side I have already learned to make
but still try to subset PCA data, I tried
the tissue column is 7th in metadata but this returns an error
If you would like to hide one tissue's ellipse in the plot, it may be better to set it's colour to NULL, I think, or NA. Have you tried that?
I tried similar approach - used white with max transparency (alpha = 0) for color generation, and set it for ellipses I do not want to be drawn. But it needs some adjustments as it dims datapoints.
It seems that you just need to select
NAas the colour mapping:NA works in my case as well. Thanks!
NULL produce error
Hi Kevin, I wanted to try
ggbiplotlibrary to try making ellipses for subset of data, however it gives an errorI found in PCAtools documentation that
pca()creates object of class 'pca' so it should work (?!) HowpcaData <- pca(rloggedtxcounts)can be transformed to ggbiplot usable data or subset ? Can you help? I want to stay with pcaData generated with your package as it transforms the data in the best way for my hypothesis (as compared to DESeq2 PCA).Hi, ggbiplot is not part of Bioconductor.
???...
This forum is for Bioconductor packages.
Is biostars.org general?
Yes, Biostars is more general (I am also moderator there), and also Bioinformatics StackExchange