Entering edit mode

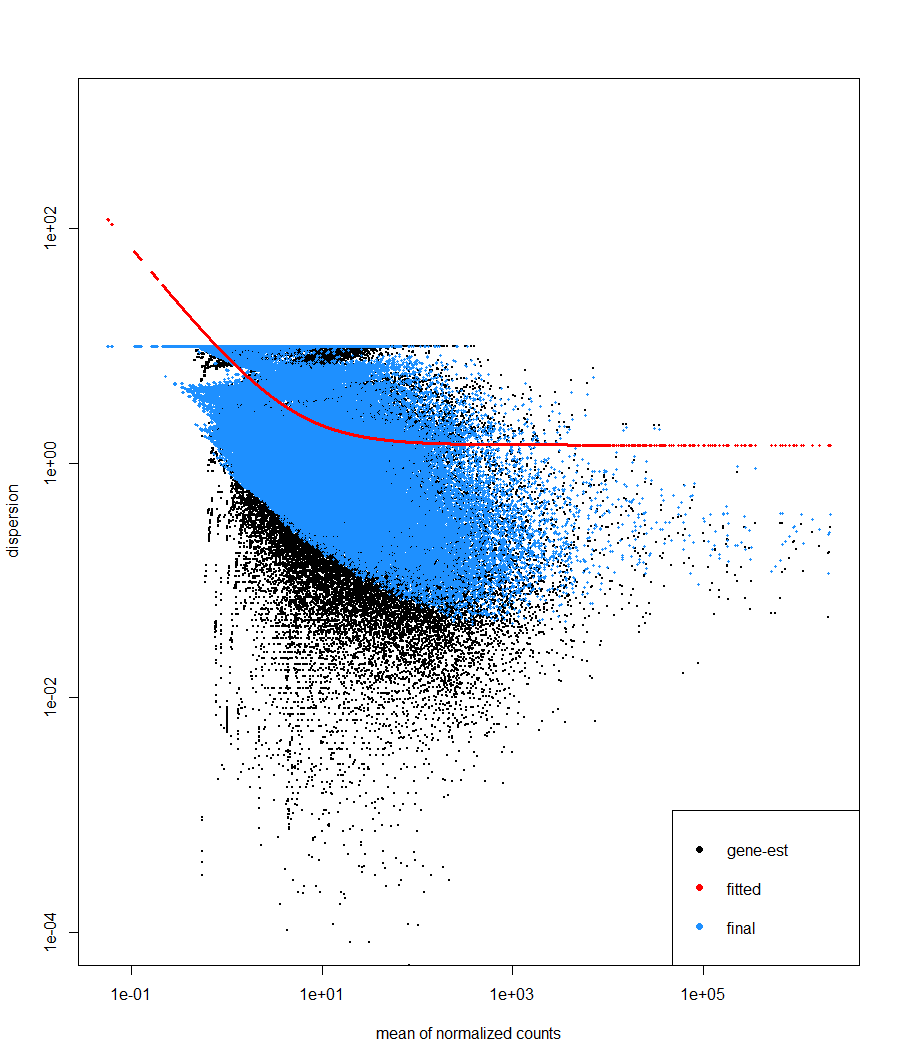
Hi, I am currently performing DE analysis on fungal gene expression in axenic and in planta conditions. I have 3 biological replicates subjected to the two conditions. When inspecting the Dispersion estimates and MA (LFC shrunk) plots, these are the plots. I don't think these plots are accurate. The dispersion plot seems to has bad fit similarly to the MA plot which does not resemble the typical shape of an MA plot. I am new in DE analysis so I need others opinion on these plots
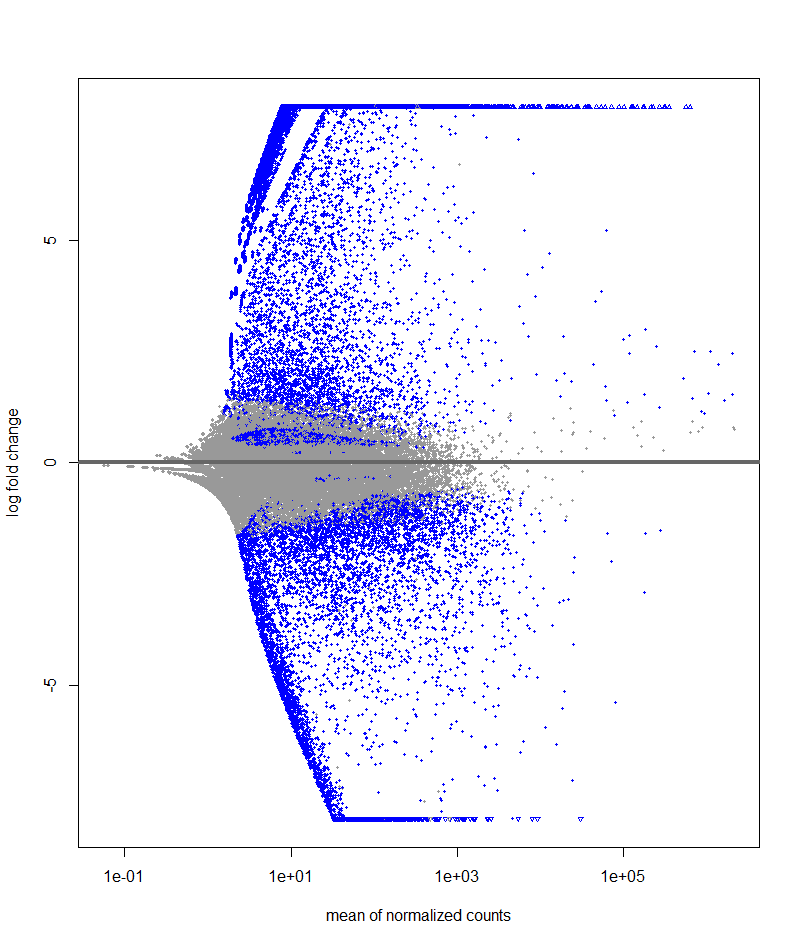
# MA-plot
resLFC <- lfcShrink(ddsTxi, coef="condition_IN_PLANTA_vs_AXENIC", type="apeglm")
plotMA(resLFC, ylim=c(-8,8))


# dispersion estimates
plotDispEsts(ddsTxi, ylim = c(1e-4, 1e3))

Thank you for the suggestion!
I pondered upon the idea of filtering before but as I read that DESeq2 performs stricter filtering, I decided on not filtering. This time, I filtered the data based your suggestion (and it should be done for visualization) and so these are the plots
I also produced PCA plot:
Am I right to suggest that:
1) The high variability of data from in planta samples as seen from PCA is causing the dispersed distribution in the dispersion plot
2) Based on the log-fold change in the MA-plot, there is a hint that there is a large difference in the expression of gene across the two treatment
Thank you!
The high variability in the PCA is attributable to condition, so does not affect the dispersion. Dispersion estimation takes into account the experimental design.
Yes, there are large differences across condition.
I would recommend pre-filtering this dataset, because the excess number of features with small count seemed to impair dispersion estimation in the first set of plots. The second pair of plots look good to me.
Thank you so much for you reply, sir. And thank you for helping other beginners like me throughout the forum!