
Hello! I performed a pathway enrichment analysis using clusterProfiler and I wanted to plot a gene network with it using the cnetplot function from the enrichplot package. However, I can't get the 0 to be in the middle of the color scale and this causes some confusion in the visual interpretation of the plot. I've seen that this topic has been already adressed on github (here and here, for example) but I honestly still don't understand what the actual solution is. Could someone post an actual example of how the code for that would look like? This is what I've done so far.
p1 <- cnetplot(pathways,
         showCategory = 10,
         foldChange = geneList,
         node_label="category",
         categorySize="pvalue")
p1 + scale_color_gradientn(colours = c("green", "red"))
And this is how the plot looks, you can see that the color scale is unevenly distributed (I'll fix the overlapping node labels later, I'm more concerned about the color issue now)
(Also, if anyone knows how to get rid of that "as.numeric(as.character(color))" that appears on top of the color scale, that would be a bonus track)
Thanks in advance!
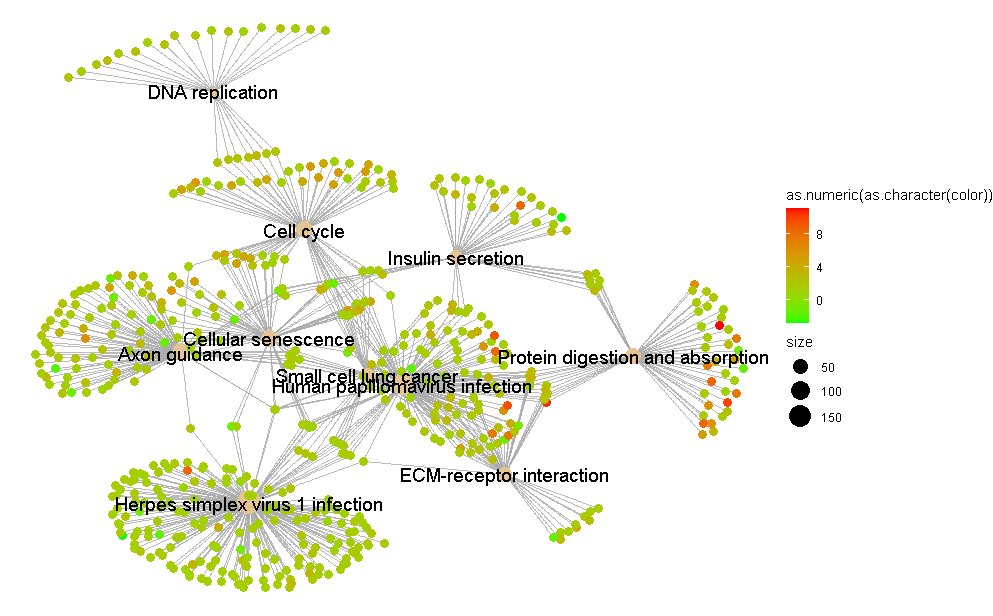
What exactly do you mean by " the color scale is unevenly distributed"? I am asking because you (apparently) use fold-changes as input for color coding, and these values (in principle) vary between 0 and infinity... What does
range(geneList)give? Also, "to get rid of that "as.numeric(as.character(color))"" you can use the argumentnamein the functionscale_color_gradientn(). E.g.:p1 + scale_color_gradientn(name = "fold change", colours = c("green", "red"))Thanks for the advice on that! As to the fold changes, the maximum value is around +12 and the minimum value about -5. What I mean is that the color in the middle of red and green isn't 0, so this makes the visual interpretation of the graph a little misleading. You can see in the image that the intermediate color between red and green corresponds to a fold change of +4, when the most intuitive thing would be that this value were 0. I am aware that the reason for this must be that I have a greater range towards the positive values rather than the negatives, but I would still like the center to be at 0. I hope I'm making myself clear.
So if I understand correctly, you are not happy with the default color gradient
cnetplotuses (i.e. blue-white-red), but rather would like to use green-red. Please note that graphs made using green-red cannot properly be interpreted by people that are color-blind, but blue-white-red graphs (apparently) can (and this is why it is the default color used bycnetplot). See e.g. here.Still, if you would like to go for a green-red color coding, why not include 'white' and use the function
scale_colour_gradient2()? To do this:p1 + scale_colour_gradient2(name = "fold change", low = "green", mid = "white", high = "red").The benefit of doing so is that the color white then represents 0, which clearly stands out.
If you still would like to go with using the function
scale_color_gradientn()like you did, then you can first extract the fold changes values of the genes to be plotted from the objectp1(i.e. the output ofcnetplot) byp1$data$color(the slotdatacontains all relevant data used to make the plot, and has the advantage that it is limited to only the genes that are in the network, and not all genes present ingeneList). Next determine the min and max values of the fold changes, and round it (better use for the latterfloorandceilingand notround):Then use the arguments
limitsandbreaksto make the plot. Note that in breaks zero (0) is added. You can of course also set the limits manually.Added: Note that you can also use
limitsandbreakswith the functionscale_colour_gradient2():In fact when I don't indicate any particular color scale, the default is white-red and not blue-red, that's why I wished to change it since white-red is not very nice to interpret. I chose green-red for no particular reason but of course I would have no issue in using a colorblind friendly scale. I tried to do it this way as you suggested
But the colors remained the same as the default (white-red), it was as if I hadn't changed anything. So I ran this other code that you also suggested
and I was able to set the color scale but I can't get the 0 to appear as white, which is what I wanted in order to make it easier to interpret visually.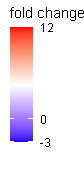
I suppose that it's because I have a wider range of values towards the positive values than towards the negative. But despite this fact, I'd still like the color scale to be even for both sides, so that white is no change, red is upregulated and blue is downregulated.
OK, what you then will need is the
rescalefunction from the libraryscales(to scale thevalues). From the help pages?scale_color_gradientnfor
values:Great, it worked now. Thanks!