Entering edit mode

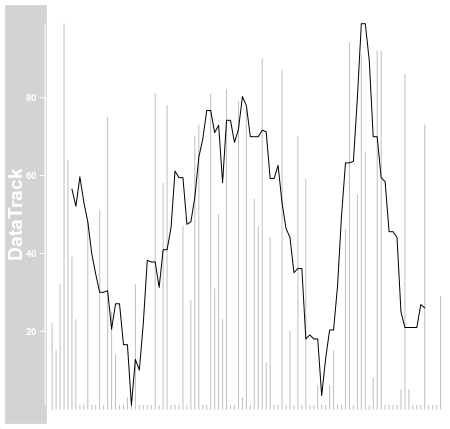
One can plot several DataTracks in Gviz using the OverlayTrack function.
library(Gviz)
library(zoo)

set.seed(0)
gr <- GRanges(seqnames = "chrI", ranges = IRanges(start = 1:100, width = 1), score = sample(x = 1:100, size = 100, prob = c(0.5, rep(0.5/99, 99)),replace = TRUE))
dt <- DataTrack(range = gr, type = "h", col = "gray")

gr_mean <- gr
gr_mean$score <- rollapply(data = gr_mean$score, width = 11, FUN = mean, fill = NA)
dt_mean <- DataTrack(range = gr_mean, type = "l", col = "black")

plotTracks(trackList = list(OverlayTrack(trackList = list(dt, dt_mean))), chromosome = "chrI")

range(gr$score)
# [1]  1 99
range(gr_mean$score, na.rm = TRUE)
# [1]  7.363636 49.727273
As stated in The Gviz User Guide
It is totally up to the user [...] to control critical aspects of the plot, like the y-axis scaling [...]
and indeed the y axis in the plot only corresponds to the first DataTrack in the example above.
Is it possible to add a second y axis (e.g. on the right of the plot) or to use custom y axis tick labels (where one could try to indicate values for both DataTracks)?
sessionInfo( )
# attached base packages:
# [1] grid      stats4    stats     graphics  grDevices utils     datasets  methods   base
# other attached packages:
# [1] zoo_1.8-9            Gviz_1.38.0          GenomicRanges_1.46.1 GenomeInfoDb_1.30.0  IRanges_2.28.0       S4Vectors_0.32.3     BiocGenerics_0.40.0