Enter the body of text here Hello everyone,
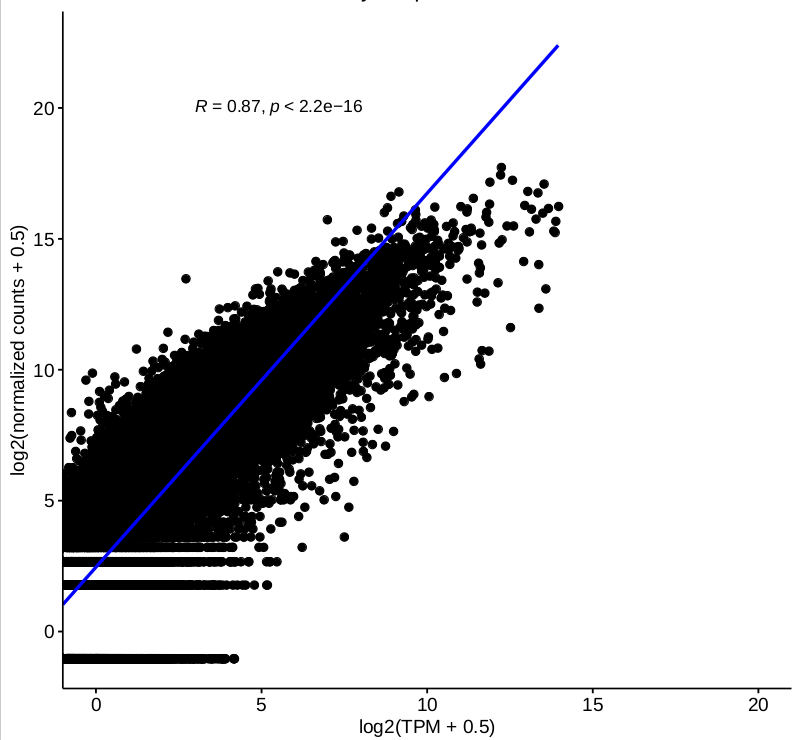
I have some questions about DESeq2 2-factor analysis. One of our ongoing project is about RNA-seq data from patient and control (2 genotypes) with or without stimulation(not stimulation, stimulation 1 and 2, 3 conditions in total), for each sample, we have different number of technical replicates, and we are very interested in interaction between genotype and condition. I tried to carry on my analysis by 2-factor mode using DESeq2 with design ~ condition + genotype + condition:genotype with collapsing the technical replicates firstly. The “results” function was used to extract individual interaction term(element from resultsNames(object)) from object has been called by DESeq. Some top DEGs were selected to do visualization by “plotcounts” function, and we found that normalized counts for some genes are not consistent with their TPM. Then we checked the correlations between log-transformed TPM and normalized counts based on 2-factor, and the correlation for single sample based on expressed genes is good
(figure 1)
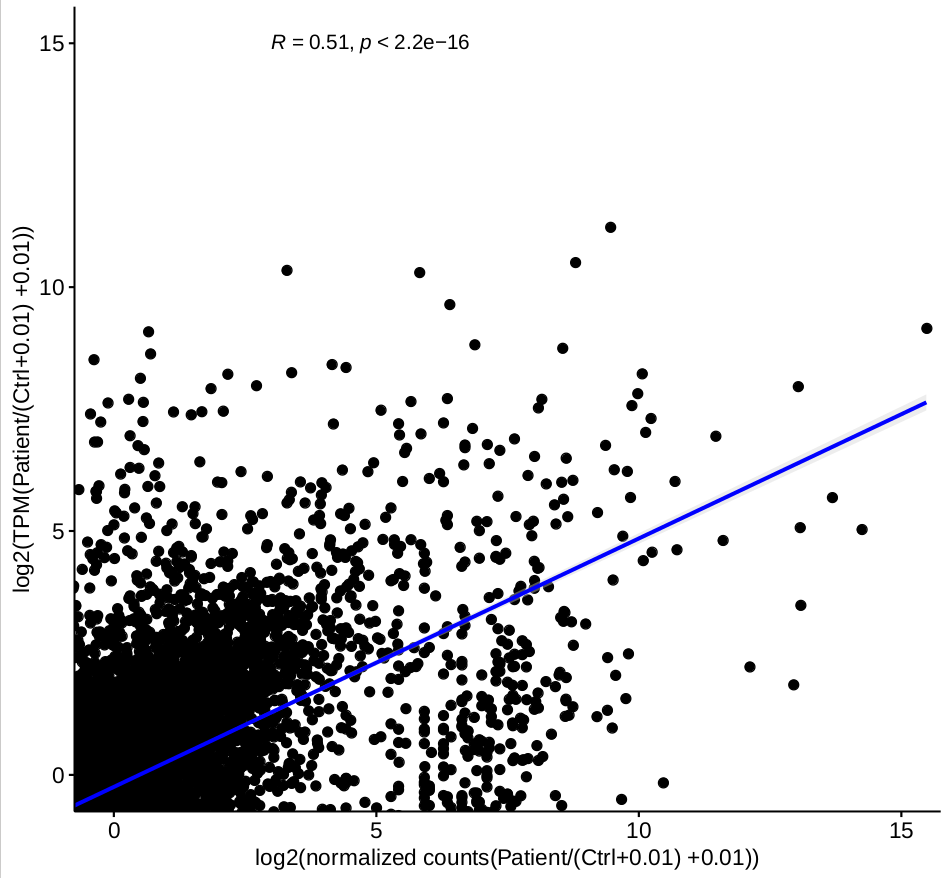
while the correlation for the ratio of each group, for example, correlation of log( normalized counts of (patient-stimulation 1/ctrl-stimulation 1) ) and log( TPM (patient-stimulation 1/ctrl-stimulation 1) ), based on 2-factor mode is not good
(figure 2)
Do you how to explain this question? Do I need to take some action to correct the normalization based on two factor?
Thank you in advance.
Code should be placed in three backticks as shown below
# include your problematic code here with any corresponding output
# please also include the results of running the following in an R session

sessionInfo( )


How did you compute TPMs? In what ways were the results vastly different? That TPMs and normalized counts don't fully correlate isn't surprising, there's a reason TPMs aren't used for statistics.
Thank you so much for you response.
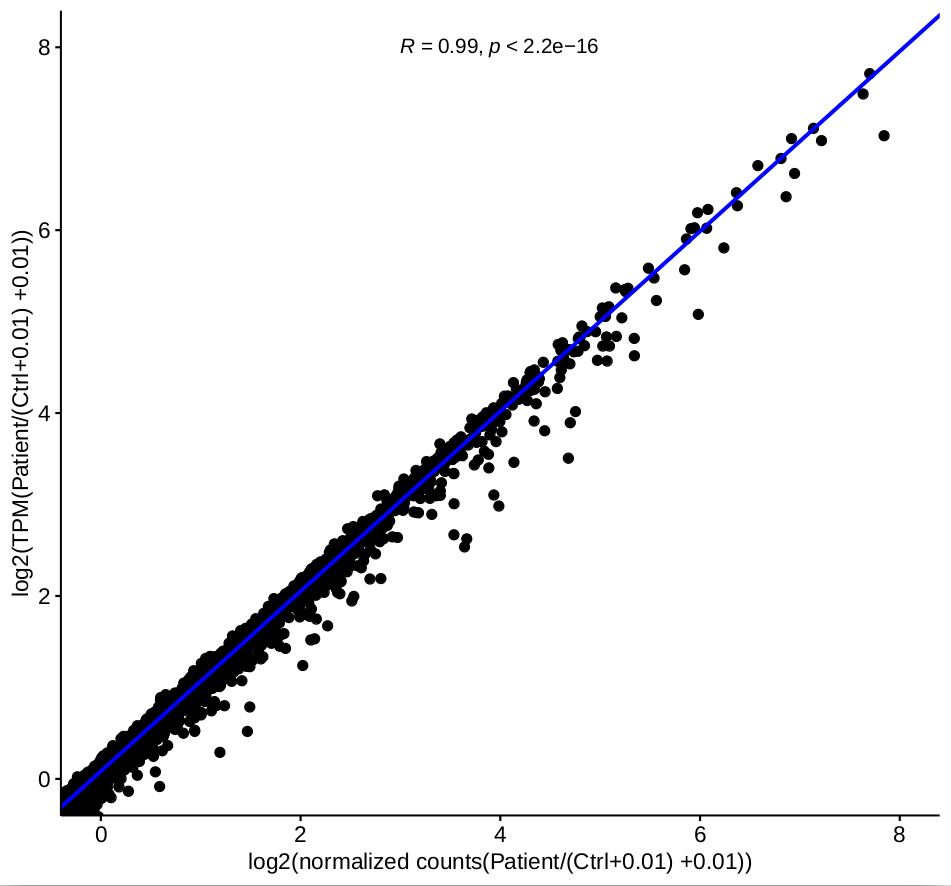
TPM is calculated by the company, I do not know which software they used to generate them. I had used kallisto to produce TPMs before. The difference is that the correlation between the ratio of normalized counts and TPM are very good based on one-factor as shown in figure 3.
Could you post your code where you make these plots?
This is the code for figure 1
normlized_counts.TPM.log = log2(normlized_counts.TPM + 0.5 )
This code for figure 2
) tpm_2.vs.5.two.factor.TPM$log.2.vs.5.TPM = log2( (((tpm_2.vs.5.two.factor.TPM[,"L.collapse"] + tpm_2.vs.5.two.factor.TPM[,"M.collapse"] ) )/2)/ (((tpm_2.vs.5.two.factor.TPM[,"D.collapse"] + tpm_2.vs.5.two.factor.TPM[,"E.collapse"] + tpm_2.vs.5.two.factor.TPM[,"F.collapse"]) )/3 + 0.01) + 0.01
)