
Hi everyone,
I started using log fold change shrinkage from the DESeq2 package in single-cell RNA-seq datasets, and I was comparing the "normal" and "apeglm" methods.
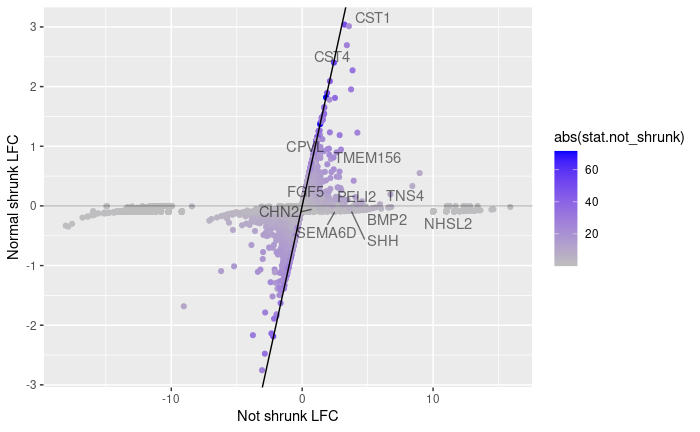
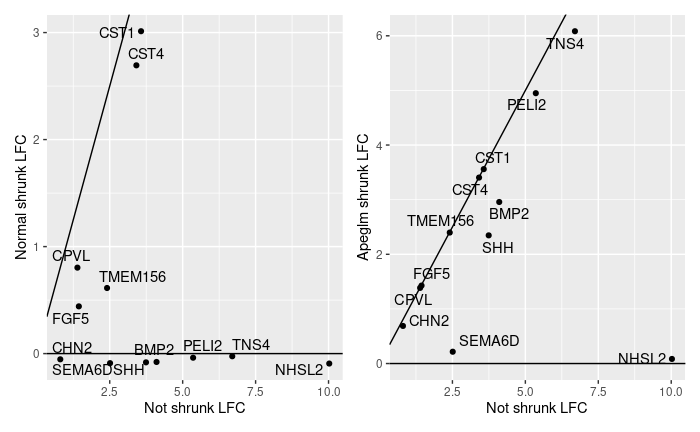
I noticed that for many genes, the normal LFC shrinkage switched the sign of the estimated LFC (4524/19243 genes), which doesn't occur for apeglm (4/19243). This was surprising, as I didn't expect a shrinkage method to turn any positive LFC into (small) negative values. Is this expected behavior from the normal shrinkage?
Upon inspection of some of these genes, very few single cells had non-zero counts, so it makes sense these should be shrunk. However, apeglm maintained a high LFC for genes with almost no counts. I included a couple of examples:
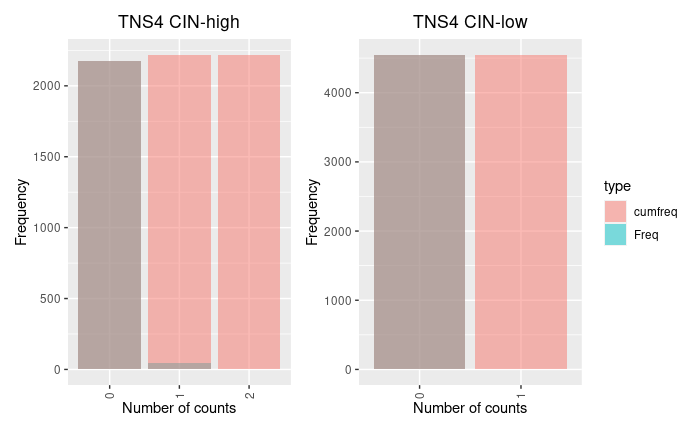
Now I'm wondering if these genes should be used at all if only a few cells have one or two counts and the vast majority (>90%) has none. I thought shrinkage would always handle these cases. The normal method apparently does, shrinking most genes to 0 (or slightly negative values?), but apeglm method seems too conservative. Should it only be used after a filter on the minimum number of counts?
Sorry if I'm missing something. Any insights?
Thanks in advance,
Pedro Tan
scRNA_cn <- readRDS(file = "output_sc/Bakhoum_scRNA.rds")
sc_counts <- Seurat::GetAssayData(scRNA_cn, assay = "RNA", slot = "counts")
df.diff.design <- scRNA_cn@meta.data %>% select(CIN_status) %>% rownames_to_column("Sample") %>%
  mutate(Sample = as.factor(Sample),
    CIN_status = as.factor(CIN_status))

deseq.dataset <- DESeqDataSetFromMatrix(
  countData=as.matrix(sc_counts),
  colData=df.diff.design,
  design=~CIN_status
) %>% estimateSizeFactors()

ddsWald <- DESeq(deseq.dataset, test = "Wald", useT = TRUE, minmu = 1e-6, minReplicatesForReplace=Inf)

ddsWald_shrunk <- lfcShrink(ddsWald, coef = "CIN_status_CIN.high_vs_CIN.low", type = "normal")

ddsWald_apeglm <- lfcShrink(ddsWald, coef = "CIN_status_CIN.high_vs_CIN.low", type = "apeglm")

sessionInfo( )
R version 4.0.3 (2020-10-10)
Platform: x86_64-pc-linux-gnu (64-bit)
Running under: Ubuntu 20.04.2 LTS

Matrix products: default
BLAS:   /usr/lib/x86_64-linux-gnu/openblas-pthread/libblas.so.3
LAPACK: /usr/lib/x86_64-linux-gnu/openblas-pthread/liblapack.so.3

locale:
 [1] LC_CTYPE=en_US.UTF-8       LC_NUMERIC=C               LC_TIME=en_US.UTF-8
 [4] LC_COLLATE=en_US.UTF-8     LC_MONETARY=en_US.UTF-8    LC_MESSAGES=en_US.UTF-8
 [7] LC_PAPER=en_US.UTF-8       LC_NAME=C                  LC_ADDRESS=C
[10] LC_TELEPHONE=C             LC_MEASUREMENT=en_US.UTF-8 LC_IDENTIFICATION=C

attached base packages:
[1] parallel  stats4    stats     graphics  grDevices utils     datasets  methods
[9] base

other attached packages:
 [1] biomaRt_2.46.3              AneuFinder_1.18.0           AneuFinderData_1.18.0
 [4] cowplot_1.1.1               infercnv_1.6.0              DESeq2_1.30.1
 [7] SummarizedExperiment_1.20.0 GenomicRanges_1.42.0        GenomeInfoDb_1.26.7
[10] glmGamPoi_1.2.0             gplots_3.1.1                pheatmap_1.0.12
[13] plotly_4.9.3                fgsea_1.16.0                proxy_0.4-26
[16] forcats_0.5.1               stringr_1.4.0               dplyr_1.0.6
[19] purrr_0.3.4                 readr_1.4.0                 tidyr_1.1.3
[22] tibble_3.1.1                tidyverse_1.3.1             org.Hs.eg.db_3.12.0
[25] AnnotationDbi_1.52.0        IRanges_2.24.1              S4Vectors_0.28.1
[28] Biobase_2.50.0              BiocGenerics_0.36.1         msigdbr_7.4.1
[31] sparseMatrixStats_1.2.1     MatrixGenerics_1.2.1        matrixStats_0.58.0
[34] ggrepel_0.9.1               ggplot2_3.3.3               patchwork_1.1.1
[37] SeuratObject_4.0.1          Seurat_4.0.1

Thanks Michael! I will stick to apeglm and incorporate alternate size factors for single cell data.
All the best, Pedro