Hi all, I have a question about the "interaction term".
my coldata is below.
 sample condition patient patient_nested status
1  S02_A       Pre     S02              1     NR
2  S02_B      Post     S02              1     NR
3  S03_A       Pre     S03              2     NR
4  S03_B      Post     S03              2     NR
5  S04_A       Pre     S04              3     NR
6  S04_B      Post     S04              3     NR
7  S05_A       Pre     S05              4     NR
8  S05_B      Post     S05              4     NR
9  S06_A       Pre     S06              5     NR
10 S06_B      Post     S06              5     NR
11 S10_A       Pre     S10              1      R
12 S10_B      Post     S10              1      R
13 S11_A       Pre     S11              6     NR
14 S11_B      Post     S11              6     NR
15 S12_A       Pre     S12              7     NR
16 S12_B      Post     S12              7     NR
17 S13_A       Pre     S13              8      R
18 S13_B      Post     S13              8      R
19 S14_A       Pre     S14              9     NR
20 S14_B      Post     S14              9     NR
21 S15_A       Pre     S15             10     NR
22 S15_B      Post     S15             10     NR
23 S16_A       Pre     S16             11     NR
24 S16_B      Post     S16             11     NR
25 S17_A       Pre     S17              2      R
26 S17_B      Post     S17              2      R
In this design, I wanted to see the different effects of treatment in conditions, so I used the interaction term.
dds <- DESeqDataSetFromMatrix(countData=met,
                              colData=coldata,
                              design=~ patient_nested + condition + status + condition:status)
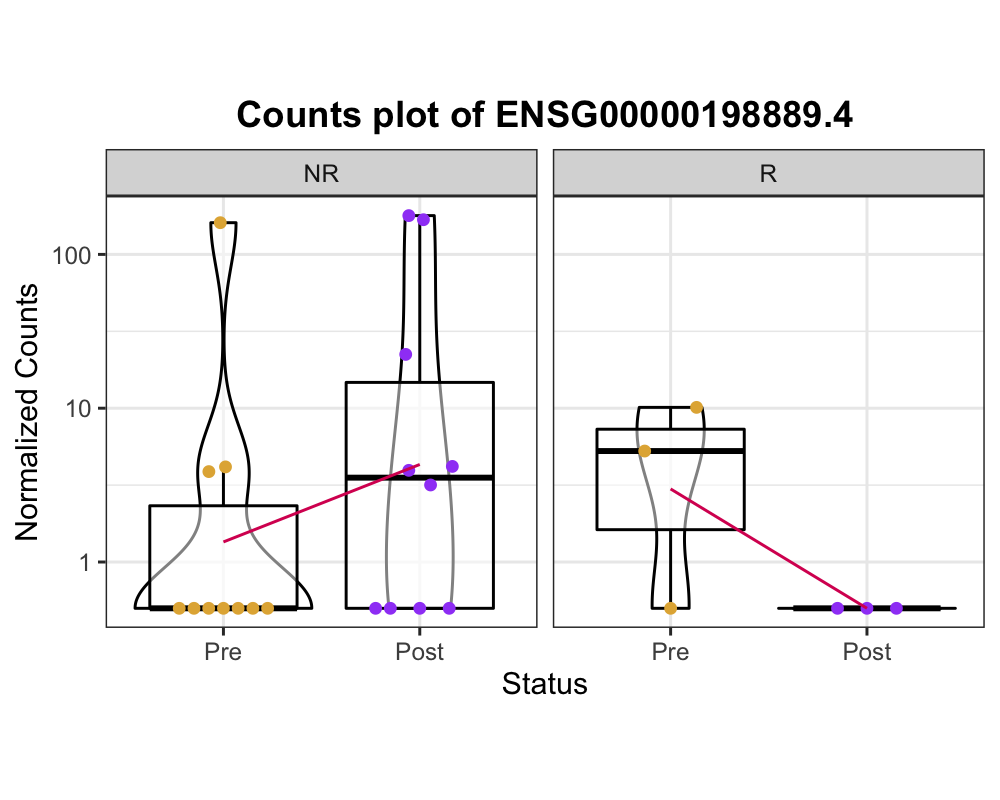
I expected the results of the different effects of treatment in conditions like below image. The expression of ENSG00000198889.4 is increased in NR and decreased in R like below image.
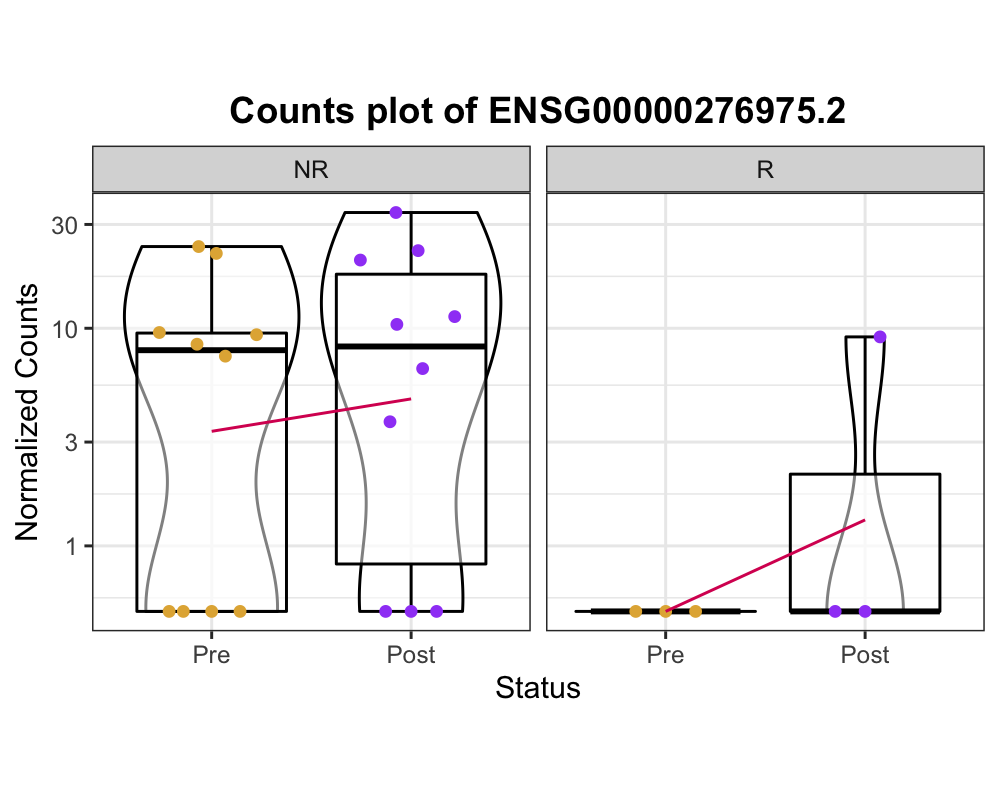
but, some of the results is not look like expected results.. see below image please.
The expression of ENSG00000276975.2 is elevated in both NR and R! It is not my expected results.
I think my design of DEseq2 is right, but I probably got this result because it was wrong.
Could you tell me why I got these result and how can I corret this problem?
Thanks!


Thanks for replying my question! But, could you explain in more detail what you said, please? I'm sorry bothering you.
If these terms are unfamiliar, I strongly recommend discussing your analysis with a statistician or someone familiar with linear models. You want to make sure to properly interpret the results.