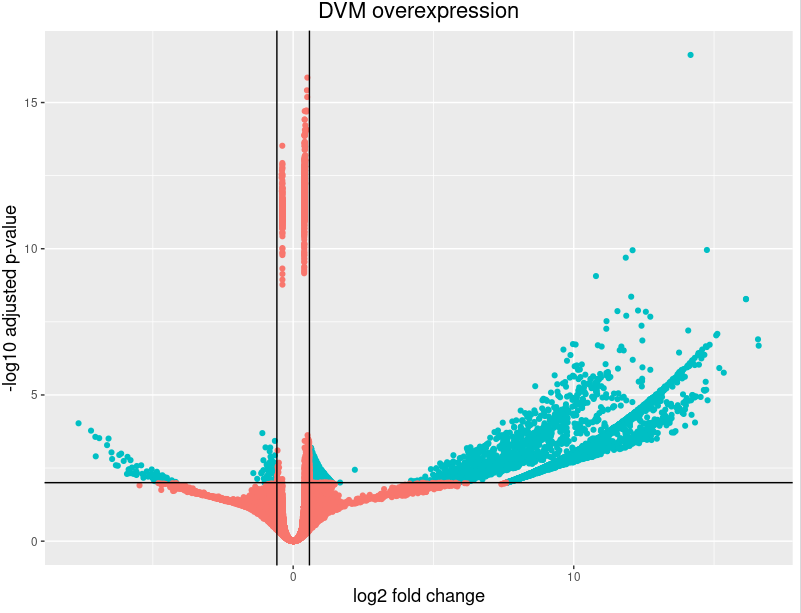
Hello,
I am using DESeq2 to process the bacterial (metatranscriptome) response between 2 conditions. Each condition includes 5 biological replicates. After finishing the DESeq2 analysis I generated a volcano plot and saw that almost all the genes with the lowest padj actually have very low log2foldChange values. All replicates in the DPS condition have zero counts for those genes while DVM replicates mostly show quite high values. I would think that comparing between zeros in the DPS condition should produce a higher log2fold change in the DVM condition. Could you please share your opinion why would this happen?
Thank you!
Rita


thank you, Michael, for your reply.
I understand the issue with the metatranscriptomic dataset and the DE analysis, however, with the complex metatranscriptome experiments, there are also not that many alternative methods to use. I did perform as many checks of the counts as possible to see if the data can fit the DESeq model and the results were not that bad.
My main issue with this is that I struggle to understand how such a difference in gene count between 2 treatments can cause such a low log2foldchange value (from my example above).
The code that I used to generate the results for the plot above:
dds <- DESeqDataSetFromMatrix(countData = data.matrix(bacterial_counts_no_outliers_bacteria_frac), colData = annotation_no_outliers_bacteria_frac, design = ~ condition)
Remove low abundant orfs:
keep = rowSums(counts(dds)) >= 10 dds_filt = dds[keep,]
Choose factor levels
dds_filt$condition=factor(dds_filt$condition, levels=c('DPS', "DVM"))
Run DESeq2
dds2=DESeq(dds_filt) res_table_DPS_DVM_shrink <- lfcShrink(dds2, coef="condition_DVM_vs_DPS", res=res_table_DVM_DPS, type="apeglm") res_table_DPS_DVM_shrink_tb <- res_table_DPS_DVM_shrink %>% data.frame() %>% rownames_to_column(var="Gene") %>% as_tibble()
res_table_DPS_DVM_shrink_tb_for_volcano_plot <- res_table_DPS_DVM_shrink_tb %>% mutate(threshold = padj < padj.cutoff & abs(log2FoldChange) >= 0.58)
please let me know if I missed something or made a mistake that could have led to such results of the log2foldchange values and such a shape of the volcano plot.
Thank you once again!
Rita
Apeglm shrinkage assumes NB distributed data. That would be my guess. Maybe try ashr which doesn’t use the data likelihood, but assumes the estimated coefficients are disturbed normal.