
Hi everyone,
i'm currently struggle with my first RNA-seq analysis. The experiment design is quite complex and therefore it's hard for me to fit any existing tutorial. The experiment delivered samples from multiple patients from different timepoints, also with a different dose of treatment. For all patients i have a sample for time point 0, called screening. Additionally i have for some patients additional timepoints i.e. day 10, day 20, day 28 etc. For most of the patients i have a sample for the end of treatment time point. All samples have no replicates.
After reading a lot about different approaches to do an analysis without replicates, i ended up with the manual of edgeR (chapter 3.5) and tried to fit it for my experiment. What i have done so far (beside mapping the reads and gathering the counts):
I created a design matrix which looks like this:
Please follow the link for better readability: https://pastebin.com/P8nP7GCX
As you can see there are all my samples for each patient and a variable top rank or low rank and also responder status. Unfortunately i have no information about remission state for the patients, so the classification for responder has been done by using the median value of the overall survival. Furthermore the top / low rank is just a ranking order by the overall survival time. I'm not sure if this is a good approach to group the samples, but for now i couldn't think of another approach to group.
Then i created my counts matrix with the correct order of the counts:
matrix <- readDGE(files)
After that i created the DGEList object:
y <- DGEList(counts=matrix)
filtergroup = c(1,1,1,1,1,1,1,2,1,2,2,2,1,1,1,1,1,1,1,1,2,2,2,2,2,2,1,1,1,1)
keep <- filterByExpr(y, group=filtergroup)
y <- y[keep, , keep.lib.sizes=FALSE]
Please note, that i used the classification of responder / non-responder as grouping.
Now i've created a contrast and run the analysis:
contrasts <- makeContrasts(ScrTopRankVsScrLowRank = Scr.LowRank-Scr.TopRank, levels = design)
y <- estimateDisp(y, design)
fit <- glmQLFit(y, design)
qlf <- glmQLFTest(fit, contrast=contrasts[,"ScrTopRankVsScrLowRank"])
topTags(qlf)
So basically if compared all of my top ranked samples from screening time point (4) vs. the lower ranked (9).
For the next step i want to create a heatmap of the normalized counts of the top DGEs. Since the result set is quite huge, i was looking for a cutoff to minimize it. The problem is, that all approaches i've found so far are using the FDR value as a cutoff, which happens to be 1 for all my DGE.
So my questions are now:
Is the general approach i'm following usable for the design of the experiment?
How to minimize the DGE, or shouldn't i do this?
I'm also very open for any suggestions which contrasts to analyze, as i'm not a biologist but a medical student who is really struggling with this analysis.
If needed i can provide some screenshots of the samples table.
Thanks for help in advance!
Regards, Kevin

Hi Gordon,
thank you very much for your reply. Here is the sample table:
The property 'Responder' was defined by the median overall survival time of each patient. So if a patient survived longer than the median, he / she is considered to be a responder. I did this on suggestion of my Professor. The filtergroup variable represents this attribute. The ranking refers to the overall survival time, too.
For the design matrix i did:
I ran an analysis comparing the top 4 ranked against the other samples, both for screening (time 0) time point and also screening vs. end of treatment. This has been suggested by a fellow in my lab.
This gives me the following heatmap: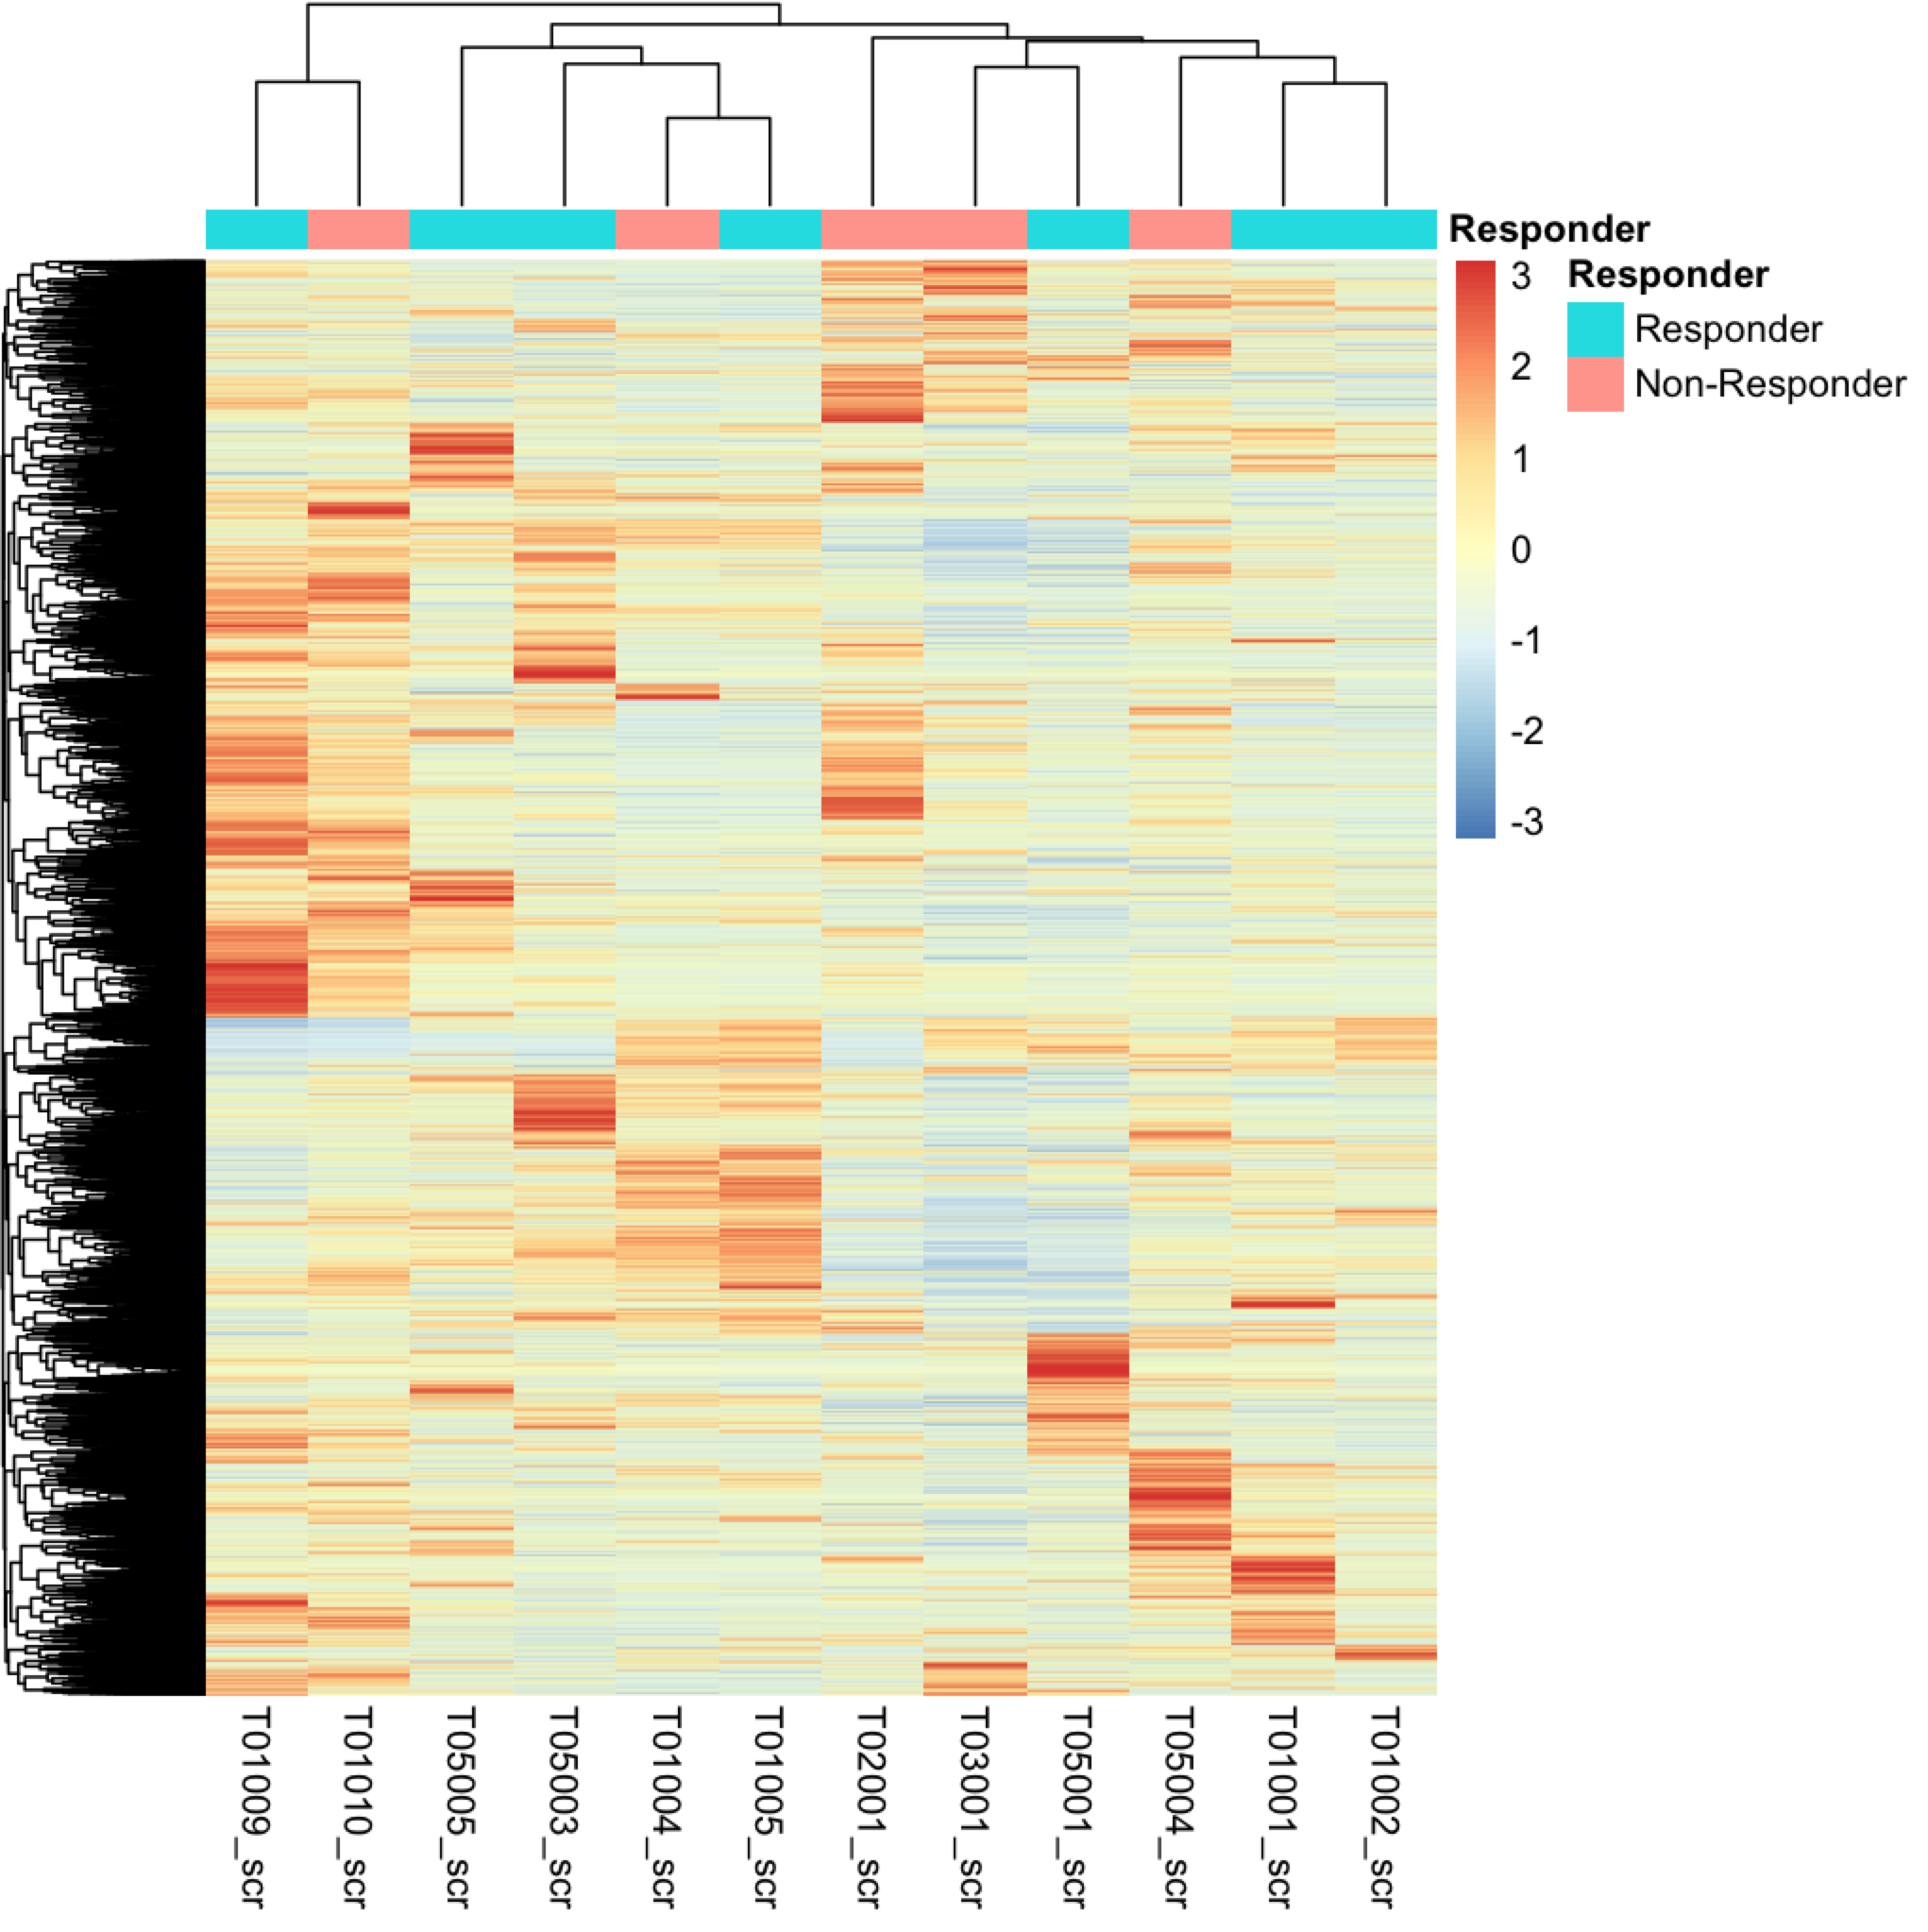
After reading more about the design matrix in the edgeR manual i found, that i maybe should create the initial design matrix like this:
Without an intercept column. But i'm not sure which one is correct.
For the FDR, it's correct that it's always 1. By huge result set i mean, that there is a long list of genes reported by topTags. Here is an example output:
I hope this additional data will clarify some things. Thanks for the advice to reach out for an bioinformatician or statistician. I'll definitely do this, but first i wanted to figure out / understand some basics so i can ask specific questions.
Regards, Kevin
Dear Kevin,
There a many issues here and I have little time to reply, so I will try to give you some brief feedback:
Your analysis is not correct. Your experiment has six different time points. You are currently treating d10, d20, d28 and d56 as the same time-point, although clearly they are not. Furthermore your analysis is treating these five time points as the baseline, whereas scr would be a more meaningful baseline. I also don't think the filtering step is appropriate, but that is a more minor concern than the treatment of timepoints.
Your dataset is very, very much underpowered for the type of analysis you are trying to do. You only have 13 patients, and most of them only have observations at one or two timepoints, so there are actually only 5 patients who are making any contribution at all to your current analysis. In my 20 years of working in genomics, I have never seen publishable results produced from such a small experiment with human subjects.
There is no suggestion from the analysis results or the heatmap of any systematic differences in your data. The differences mostly appear to be patient-specific. There does not appear to be any significant differential expression, and that's what one would expect from such an underpowered experiment.
I feel it is important that you consult an experienced RNA-seq analyst to trouble-shoot whether it is reasonable to expect this dataset to yield any useful results. This would start with some quality checking and graphical exploration of the data.
You haven't articulated any scientific questions you are trying to answer and that is normally a starting point to designing an analysis. I suggest you have a discussion with your professor and with the experienced analyst as to what questions might be interesting to pose. I suspect you will need to tone down the complexity of the questions you are trying to answer in view of the limitations of the data.
It makes no difference whether you use
~Patientor~0+Patient. Both will give identical results.I don't think it would be fruitful for me to make detailed corrections to the code, but I will note that your contrast statement makes reference to columns that are not in the design matrix. Also the code does not explain what is shown in the heatmap.
topTagsgives the number of top genes that you ask for. It will only give a long list if you ask for a long list. By default it just shows you the top 10.Hi Gordon,
thanks again for your reply. First my biological questions i want to to pursue:
Q1) To find genes differentially expressed (DE) between screening time point samples:
So if i understood it right with my group i grouped the samples intro three groups: 1: screening time point samples with a high rank for overall survival, 2: screening time point samples with a low rank and 3: all other time points. With
coef=2i compared group 2 vs. 1.Again this doesn't give me a list of DGEs with significance, but i understand that this maybe won't be the case for any contrast due to the experiment design / amount of samples.
The thing i want to know is, if at least the analysis for my question in this case is correct.
Q2/3: The overall goal is to identify genes / pathways which a differently regulated in screening time point (my professor calls this the baseline question) and later on to find DGEs for the contrast of screening time point vs. end of treatment time point (he calls it the dynamic question). After finding this genes / pathway i have done an experiment with two cell lines with comparable treatment and i'm going to try to compare the genes / pathways from the human samples with the results of this cell line experiments.
But currently i'm not sure how to find this genes / pathway. When i'm doing a heatmap on all counts of the screening time point samples i got this:
Which looks quite heterogeneous for me. Should i try to work with k-means here? If i understand this right k-means could help me to identify sub-clusters which i could you for more focused analysis for DGE. The grouping for responders / non-responder is again just classified by the overall survival median above / below status. Basically it's just to have a quick look if these samples cluster together, which in my opinion they don't do completely.
Is this approach basically the right way? Or am i completely misunderstanding the concepts?
Again, thanks for your advice to reach out for an analyst at my university to get help with this.
Regards,
Kevin
No your approaches are not right -- differences between patients can't be ignored when assessing time effects and clustering can't be used a precursor to DE analysis. It is not true that k-means can be used to identify a more focused DE analysis. Your original approach was closer to the mark. This is an unbalanced multilevel experiment (in the sense explained in the limma User's Guide).
This would be a very difficult dataset to analyse even for an experienced analyst and, to be honest, I am not sure that you are understanding the issues involved. I would personally analyse this data in limma rather than in edgeR because of it's ability to model random effects and quality weights.
Having said that, there is no analysis that can discover signal in a dataset that doesn't have any. The first exploration step normally would be to make an MDS plot to see whether the samples separate in the way you would expect. All the case studies in the limma and edgeR documentation show MDS plots.
I only have time to explain software syntax rather than to design analyses so I will have to leave it here. Your professor's comments about "baseline" and "dynamic" questions are on the ball. It is your professor's responsibility to make sure you have the necessary guidance and technical assistance.