Hi Bioconductor Support,
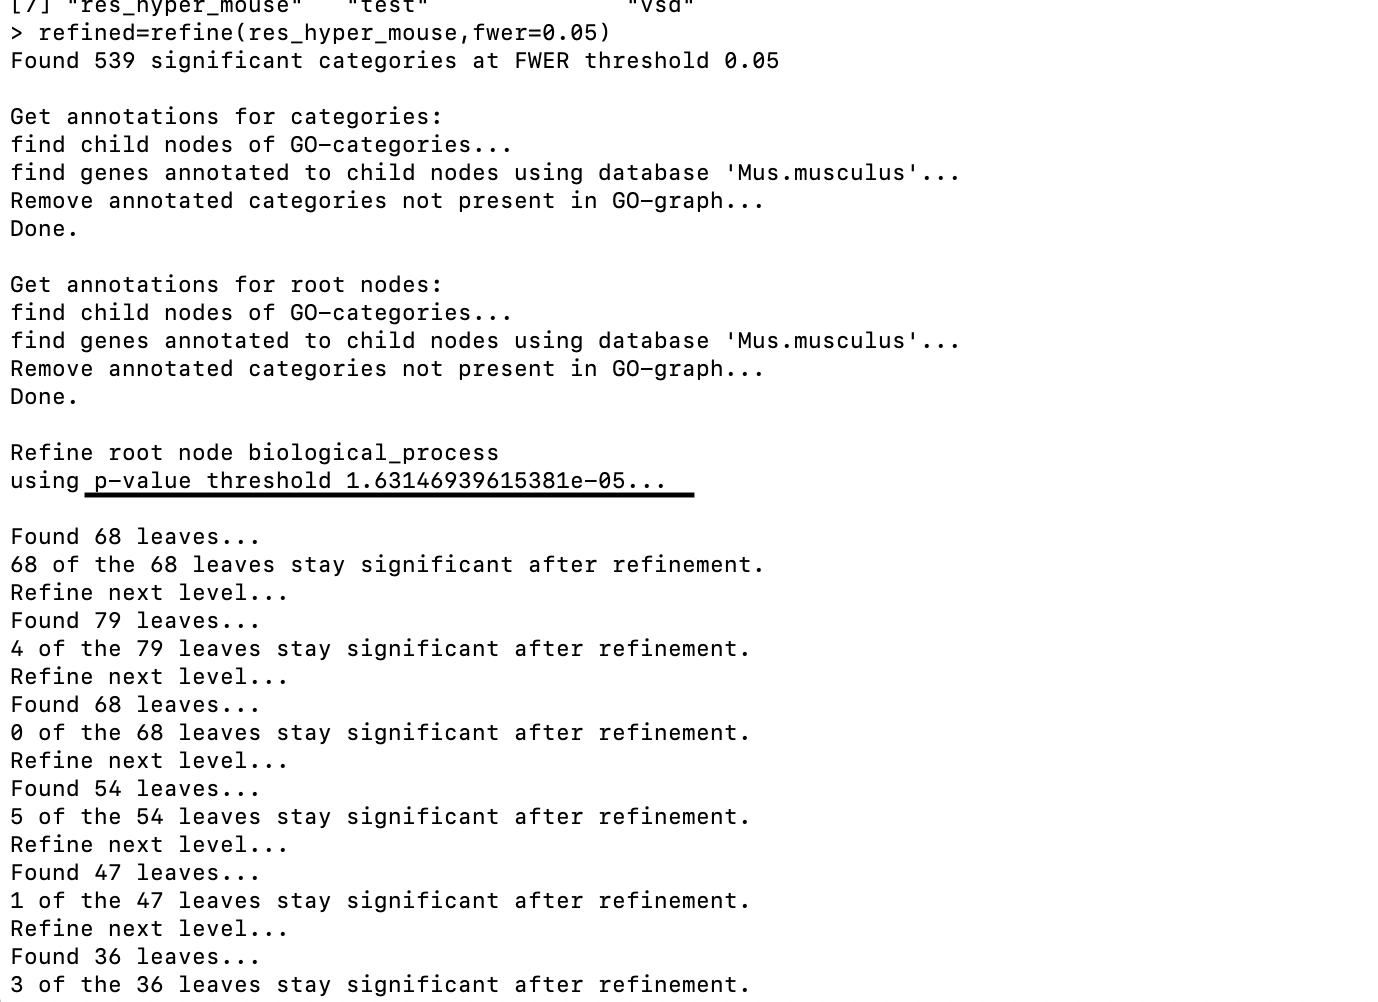
I tried to run the "refine" function from the GOfuncR package and noticed that different GO catetories used different p-value threshold for significance (as shown in the screenshot). My question is: how this threshold was selected? Can I have my own threshold?
Thanks
C.
# include your problematic code here with any corresponding output
# please also include the results of running the following in an R session

sessionInfo( )


Hi Steffi,
My outputs showed that some of the GO terms had quite different p-values after refinement. May I say those GO terms have many genes removed as child-terms? Is there a way to find what genes were removed actually during the refinement?
Thanks a lot.
C.