
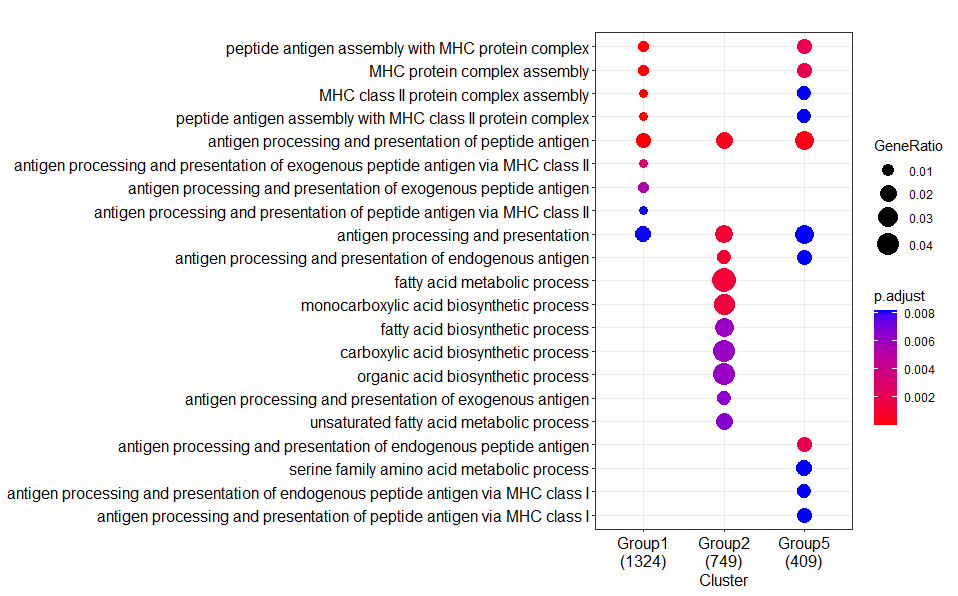
I have a gene list containg 5 groups, and use the clusterProfiler compareCluster-enrichGO function to do the Biological Process funtional enrichment. However, different computers produce two different enrichment results with the same gene list and packages (same version).
Result 1:
Tested in two Lenove laptops with AMD CPUs, one Apple Mac with A1 CPU
Result 2:
Tested in one HP desktop, one Lenove laptop and one Apple Mac with Intel CPUs
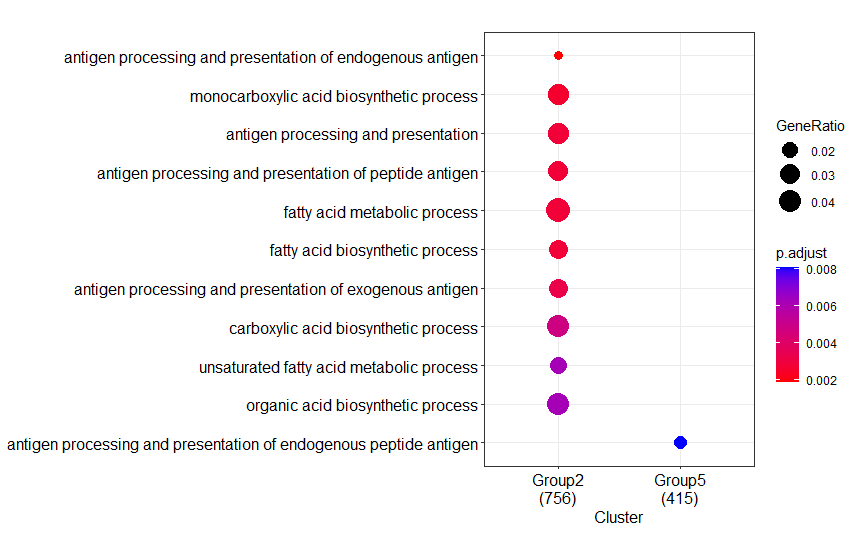
I know little about the statistic behind, but both results seem reasonable for my study. Now I just want to know which result is the true one and how the difference happened. BTW, the difference exist while I tried other gene lists.
I attached the data and code here if you are interested to make a test enter link description here https://drive.google.com/drive/folders/1fhg9IGurlw5U9PUKfNNccNhj5M4CRzH4?usp=sharing (see if I make the link right==)
Thanks for comments!
# include your problematic code here with any corresponding output
# please also include the results of running the following in an R session

library(clusterProfiler)
library("org.Hs.eg.db")

load("enrich_gene_list_for_test.RData")
enrich_gene_list_for_test
test_enrich <- compareCluster(geneCluster = enrich_gene_list_for_test,
                                  ont           = "BP",
                                  OrgDb = org.Hs.eg.db,
                                  pAdjustMethod = "BH",
                                  pvalueCutoff  = 0.01,
                                  qvalueCutoff  = 0.05,
                                  readable      = TRUE,
                                  fun =  enrichGO)

dotplot(test_enrich,label_format = 100,showCategory=40)

sessionInfo()


sessionInfo( )
R version 4.1.2 (2021-11-01)
Platform: x86_64-w64-mingw32/x64 (64-bit)
Running under: Windows 10 x64 (build 22000)

Matrix products: default

locale:
[1] LC_COLLATE=Chinese (Simplified)_China.936  LC_CTYPE=Chinese (Simplified)_China.936    LC_MONETARY=Chinese (Simplified)_China.936
[4] LC_NUMERIC=C                               LC_TIME=Chinese (Simplified)_China.936

attached base packages:
[1] stats4    stats     graphics  grDevices utils     datasets  methods   base

other attached packages:
[1] org.Hs.eg.db_3.14.0   AnnotationDbi_1.56.2  IRanges_2.28.0        S4Vectors_0.32.3      Biobase_2.54.0        BiocGenerics_0.40.0
[7] clusterProfiler_4.2.0
Are you really sure that the package versions are identical? Especially the library
GO.db?--> The differences between your Result1 and Result2 regarding the absence of some clusters (groups) and the numbers below each of the clusters, that represent the number of annotated genes in each of you input lists (=groups), strongly hints to a difference in the number of genes that were actually annotated to a GO category.
enrichGOperforms a 'simple' one-sided version of Fisher’s exact test to find enriched GO categories. This type of test involves the analysis of contingency tables, which is nothing more (or less) than scoring the number of genes that are, and are not, in a specific GO category... In contrast, when you would have usedgseGO(for GSEA analysis), then it involves permuting you data. Permutations are random, so in that case some (very) small differences between runs are expected. (See for more info on the differences between the types of test here: what the test method for enrichGO in clusterProfiler?).The large differences you show can IMHO only be explained by differences in the number of annotated genes in a GO category...
I ran your example,and I got exactly the same results as in your Result1...! I am using a PC (HP, Windows10) with an Intel Core i7 processor, and used R version 4.1.1 with
GO.dbversion 3.14.0.Thanks for your testing here. I checked the GO.db package specifically and confirmed the same version GO.db_3.14.0 included.
As you can see, seems no difference in package version.
Actually, my colleagues help test in clusterProfiler_3.XXX version (and related packages), and get results very similar to result2. So I wonder if the package ver Test_result3
====
sessioninfor from Intel desktop for result2
R version 4.1.1 (2021-08-10) Platform: x86_64-w64-mingw32/x64 (64-bit) Running under: Windows 10 x64 (build 19043)
Matrix products: default
locale: 1 LC_COLLATE=Chinese (Simplified)_China.936 LC_CTYPE=Chinese (Simplified)_China.936
[3] LC_MONETARY=Chinese (Simplified)_China.936 LC_NUMERIC=C
[5] LC_TIME=Chinese (Simplified)_China.936
system code page: 1252
attached base packages: 1 stats4 stats graphics grDevices utils datasets methods base
other attached packages: 1 GO.db_3.14.0 clusterProfiler_4.2.0 org.Hs.eg.db_3.14.0 AnnotationDbi_1.56.2 IRanges_2.28.0
[6] S4Vectors_0.32.3 Biobase_2.54.0 BiocGenerics_0.40.0
not full edited...
So I wonder, package version difference may not fully explain the huge difference, even if it really exists here. And maybe some more important factors are ignored.
That's indeed very remarkable...!
To be honest, I don't know what may be causing the discrepancies you observed.
For maximal reproducibility I used the sample data set included with DOSE, and ran
enrichGOaccording to your code on both my Win10 and Linux machine. I obtained identical results... Could you please try my code as well, and compare with my results? Again, I got identical results on both my machines.Also, to exclude it has something to do with the Gene Ontology annotation; could you also run it with
enrichKEGGto see whether discrepancies occur, or not? The gene sets from KEGG don't have any hiearchy (like parents, ancestors, etc).SessionInfo() Linux machine:
I tested your code in both my AMD laptop (machine get result1 as yours) and Intel desktop (get different result2)
I would like to put out all the information Intel desktop results for your reference:
Matrix products: default
locale: 1 LC_COLLATE=Chinese (Simplified)_China.936 LC_CTYPE=Chinese (Simplified)_China.936
[3] LC_MONETARY=Chinese (Simplified)_China.936 LC_NUMERIC=C
[5] LC_TIME=Chinese (Simplified)_China.936
system code page: 1252
attached base packages: 1 stats4 stats graphics grDevices utils datasets methods base
other attached packages: 1 GO.db_3.14.0 clusterProfiler_4.2.0 org.Hs.eg.db_3.14.0 AnnotationDbi_1.56.2 IRanges_2.28.0
[6] S4Vectors_0.32.3 Biobase_2.54.0 BiocGenerics_0.40.0
Here may also attached the information in AMD laptop
GO
dotplot(test_enrich,label_format = 100 ,showCategory=20, font.size=8)
KEGG
dotplot(test_kegg ,label_format = 100 ,showCategory=20, font.size=8)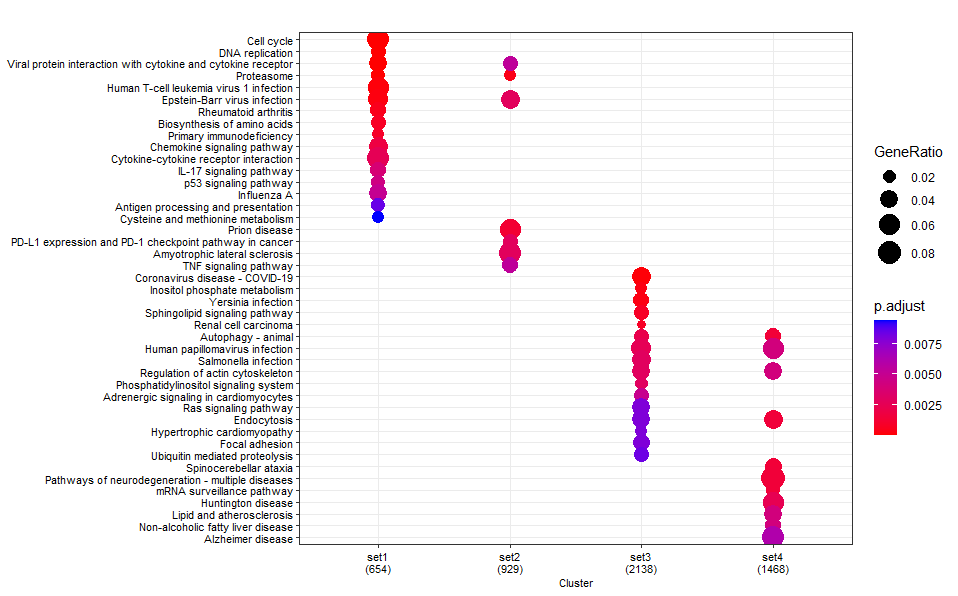
sessioninfor from AMD laptop
R version 4.1.2 (2021-11-01) Platform: x86_64-w64-mingw32/x64 (64-bit) Running under: Windows 10 x64 (build 22000)
Matrix products: default
locale: 1 LC_COLLATE=Chinese (Simplified)_China.936 LC_CTYPE=Chinese (Simplified)_China.936 LC_MONETARY=Chinese (Simplified)_China.936 [4] LC_NUMERIC=C LC_TIME=Chinese (Simplified)_China.936
attached base packages: 1 stats4 stats graphics grDevices utils datasets methods base
other attached packages: 1 GO.db_3.14.0 org.Hs.eg.db_3.14.0 AnnotationDbi_1.56.2 IRanges_2.28.0 S4Vectors_0.32.3 Biobase_2.54.0
[7] BiocGenerics_0.40.0 clusterProfiler_4.2.0
sorry that I do not know how to make the copied information look better. Really thanks a lot for your effort here!
Please note that you can use the button labeled
CODE(5th from left) to format your text as code.Let's compare the results ( I copied the most relevant output):
GO ORA (using
enrichGO):Confirm that the gene input is indeed the same for my and both your analysis:
My result:
Your AMD result:
--> Numbers are indeed the same as mine!
Your Intel result:
--> These numbers indeed differ substantially....
Have a look at the details:
Stats results from my run:
Stats results from your (identical) AMD run:
Note that all numbers, including those for foreground and background genes, are the same.
For example, for first GO category (GO:0140014) these are 68/1186 and 287/18723. Therefore identical p- and FDR values are calculated.
Note that in total 18723 genes have been assigned a GO annotation.
Stats from your differing Intel run:
Note that all numbers, including these of fore- and background genes, differ!
For GO category GO:0140014 the fore/background gene numbers are 69/1189 and 296/18862. Therefore different p/FDR values.
Also, in total 18862 genes have been assigned a GO annotation.
My conclusion: somehow the underlying GO annotations are different between your 2 systems.
I recommend to force a reinstall of the relevant annotation packages on both machines in a fresh R session:
KEGG ORA (using
enrichKEGG):If you compare the 3
enrichKEGGresults, then it turns out identical results are returned for all fore- and background numbers (ratios), and thus statistical results.This is because
enrichKEGGdownloads the KEGG pathway information on-the-fly from the KEGG website each time it is executed.You can therefore exclude that the observed differences are due to platform-introduced (rounding) differences when doing the calculations.
Great thanks to you Guido!
It really works by force reinstalling the packages. Although the sessioninfor remained unchanged, the Intel desktop now produce the identical result as from the AMD laptop.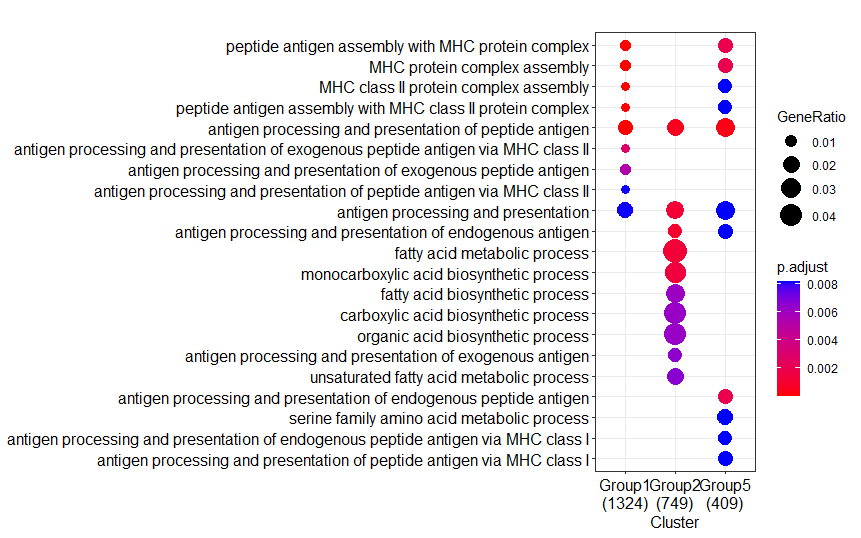
Platform: x86_64-w64-mingw32/x64 (64-bit) Running under: Windows 10 x64 (build 19043)
Matrix products: default
locale: 1 LC_COLLATE=Chinese (Simplified)_China.936 LC_CTYPE=Chinese (Simplified)_China.936
[3] LC_MONETARY=Chinese (Simplified)_China.936 LC_NUMERIC=C
[5] LC_TIME=Chinese (Simplified)_China.936
system code page: 1252
attached base packages: 1 stats4 stats graphics grDevices utils datasets methods base
other attached packages: 1 GO.db_3.14.0 org.Hs.eg.db_3.14.0 AnnotationDbi_1.56.2 IRanges_2.28.0 S4Vectors_0.32.3
[6] Biobase_2.54.0 BiocGenerics_0.40.0 clusterProfiler_4.2.1
Now my posted issue turns out to be a stupid question... Your logical, convincing analysis and huge testing effort paied here really warm my heart. Greatly appreciate it!
Finally, I guess that I should select the updated result1 for my further analysis. And also send the information to my colleagues to update the pakcages. However, honestly, I now feel somehow more confused and lots of uncertainty. Seems that more comprehensive results are still in the future.
Thanks again Guido!
Glad to hear it has been solved!
You will know that gene annotations may change over time. For each biannual Bioconductor release, the Bioconductor core team creates snapshots of many publicly available annotation databases, and also archives these. This allows for generating fully reproducible results. That's the reason why in the end the both of us obtained identical results (but this would not have been the case if we would have used different versions of R/Bioconductor).
Bottom line: if you have installed a version of Bioconductor together with the annotation packages of that release version, then results should always be identical.
This command may be useful to check:
BiocManager::valid()Again, glad to get another useful command tip~
Not only for the specific posted issue here, but also for all the warm insights you shared, I want to say thanks more than once and twice. As an immature beginner for this area, I really feel luck here to get this learning experience from you. Thank you Guido for all your shared. Here my best wishes to you for the coming new year ~