Entering edit mode
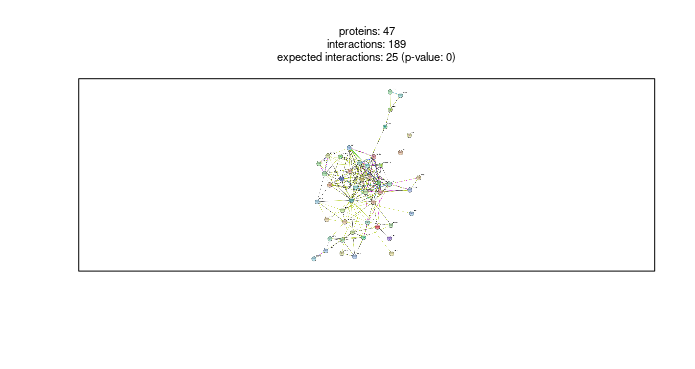
I am trying to create STRINGdb networks using the R package, and it seems to generate images that are extremely low quality (see attached)
Is there a way to generate high quality images? These are so bad I cannot even read the protein names. Ideally I would like to generate hi-res publication quality images.
string_db <- STRINGdb$new( version="11", species=9606,score_threshold=200, input_directory="")
STRINGdb$help("map")
example1_mapped <- string_db$map(GripStrengthCors.sigProt.Tissues2, "target", removeUnmappedRows = TRUE)
string_db$plot_network(example1_mapped$STRING_id)


> sessionInfo()
R version 4.0.3 (2020-10-10)
Platform: x86_64-pc-linux-gnu (64-bit)
Running under: CentOS Linux 7 (Core)

Matrix products: default
BLAS/LAPACK: /usr/lib64/libopenblas-r0.3.3.so

locale:
 [1] LC_CTYPE=en_US.UTF-8       LC_NUMERIC=C               LC_TIME=en_US.UTF-8        LC_COLLATE=en_US.UTF-8     LC_MONETARY=en_US.UTF-8
 [6] LC_MESSAGES=en_US.UTF-8    LC_PAPER=en_US.UTF-8       LC_NAME=C                  LC_ADDRESS=C               LC_TELEPHONE=C
[11] LC_MEASUREMENT=en_US.UTF-8 LC_IDENTIFICATION=C

attached base packages:
[1] stats     graphics  grDevices utils     datasets  methods   base

other attached packages:
 [1] Hmisc_4.6-0      Formula_1.2-4    survival_3.2-13  lattice_0.20-45  gprofiler2_0.2.1 jsonlite_1.7.2   STRINGdb_2.2.2   ggpubr_0.4.0
 [9] magrittr_2.0.1   forcats_0.5.1    stringr_1.4.0    dplyr_1.0.7      purrr_0.3.4      readr_2.1.0      tidyr_1.1.4      tibble_3.1.6
[17] ggplot2_3.3.5    tidyverse_1.3.1

loaded via a namespace (and not attached):
 [1] bitops_1.0-7        fs_1.5.0            lubridate_1.8.0     bit64_4.0.5         RColorBrewer_1.1-2  httr_1.4.2
 [7] tools_4.0.3         backports_1.3.0     utf8_1.2.2          R6_2.5.1            rpart_4.1-15        KernSmooth_2.23-20
[13] DBI_1.1.1           lazyeval_0.2.2      colorspace_2.0-2    nnet_7.3-16         withr_2.4.2         gridExtra_2.3
[19] tidyselect_1.1.1    bit_4.0.4           compiler_4.0.3      chron_2.3-56        cli_3.1.0           rvest_1.0.2
[25] htmlTable_2.3.0     xml2_1.3.2          plotly_4.10.0       checkmate_2.0.0     caTools_1.18.2      scales_1.1.1
[31] digest_0.6.28       foreign_0.8-81      jpeg_0.1-9          base64enc_0.1-3     pkgconfig_2.0.3     htmltools_0.5.2
[37] plotrix_3.8-2       dbplyr_2.1.1        fastmap_1.1.0       htmlwidgets_1.5.4   rlang_0.4.12        readxl_1.3.1
[43] rstudioapi_0.13     RSQLite_2.2.8       generics_0.1.1      gtools_3.9.2        car_3.0-12          RCurl_1.98-1.5
[49] Matrix_1.3-4        Rcpp_1.0.7          munsell_0.5.0       fansi_0.5.0         abind_1.4-5         proto_1.0.0
[55] lifecycle_1.0.1     sqldf_0.4-11        stringi_1.7.5       carData_3.0-4       gplots_3.1.1        plyr_1.8.6
[61] grid_4.0.3          blob_1.2.2          crayon_1.4.2        splines_4.0.3       haven_2.4.3         hash_2.2.6.1
[67] hms_1.1.1           knitr_1.36          pillar_1.6.4        igraph_1.2.8        ggsignif_0.6.3      reprex_2.0.1
[73] glue_1.5.0          latticeExtra_0.6-29 data.table_1.14.2   modelr_0.1.8        png_0.1-7           vctrs_0.3.8
[79] tzdb_0.2.0          cellranger_1.1.0    gtable_0.3.0        assertthat_0.2.1    gsubfn_0.7          cachem_1.0.6
[85] xfun_0.28           broom_0.7.10        rstatix_0.7.0       viridisLite_0.4.0   memoise_2.0.0       cluster_2.1.2
[91] ellipsis_0.3.2


Dear Jarod,
The image should be of much higher resolution. If you use R-studio make sure your export settings are correct. The indication is that text is similarly low-res, so it's not the network image itself, but how it's rendered in your interface.
Best, Damian.
Thank you for the reply Damian. I am using R-studio, but I don't think it is a setting in R-studio because all other plots I am generating in the session are high quality. I have also tried
which just generates just an empty plot (I have also tried calling print and draw).
Is there a setting that you recommend changing? I am not an extremely experienced user and am not familiar with altering R settings.
best, Jarod
The width and hight here are probably in pixels not inches (see Cairo documentation)... so I would recommend values much larger than 10 (something like 1000x1000 or more).
When you plot an image in R-Studio you have an option to export -> save as PNG (and change the width-hight to at least 1000). The image will come up in the correct quality.
My apologies, I did not realize you meant these very simple settings. I have of course tried this, and the image above was generated with something like export -> save to PNG 1400 x 900. I also did try various sizes of exports and this had no effect on the image quality, which remained very low as above.
And the default width and height for CairoPDF is actually inches, I know this may be confusing since other Cairo functions use pixel width or mm as default. 10 x 10 should generate a large image.
Dear Jarod,
I can't really reproduce the issue. The image is delivered in decent quality, as it uses standard STRING API: See the sample here. For me setting the export hight-width to higher values solves the issue with the rendering.
If you do not find a solution. You can simply input your list to STRING (https://version-11-0.string-db.org). For publication there is an option to export very hi-res version through the web-interface.
Sorry I can't be more helpful.
Best, Damian
Hi Damian,
I will try to figure it out and post my solution here if I find one. The reason I turned to the R package is because I wanted to use the payload mechanism to color nodes by a few additional parameters in my analyses (namely coloring by tissue and cell type). I would also like to do this for many dozens of networks, so the programmatic interface was preferable. Is there a way to do this with the web interface though?
Jarod
Dear Jarod,
Sorry for the inconvenience. There are indeed other ways to generate the picture.
Best, Damian.
Hello Jarod,
Did you find a solution for this? I'm just using this package for the first time and the quality of the images are indeed terrible and completely unreadable.
Cheers,
Alvaro
As written at the end:
get_png method will save the picture directly as it comes from the server. This method is used by plot_network() which just packages the picture in a figure.
I'm guessing you are using RStudio. The displayed image is scaled to the according to the viewpoint, and this is the default resolution it saves at (read: very low). You should specify the dimensions of the image before you save it (for example width 2000px rather than what is the default 500px + maintain the aspect ratio). This (or selecting export->PDF) for me saves the image in the correct resolution.