Hi there :)
I'm working with the DESeq2 R package for analyzing RNA-Seq data. I have 16 samples and 2 treatments (8 vs 8).
My goal at the moment is to do a preliminary visualization/clustering of my samples with things like a heatmap of the counts matrix, another of the sample-to-sample distances and a PCA. Following the instructions at http://bioconductor.org/packages/release/bioc/vignettes/DESeq2/inst/doc/DESeq2.html#se, I'm exploring different methods for transforming the variance, which otherwise would be dependent on the mean counts.
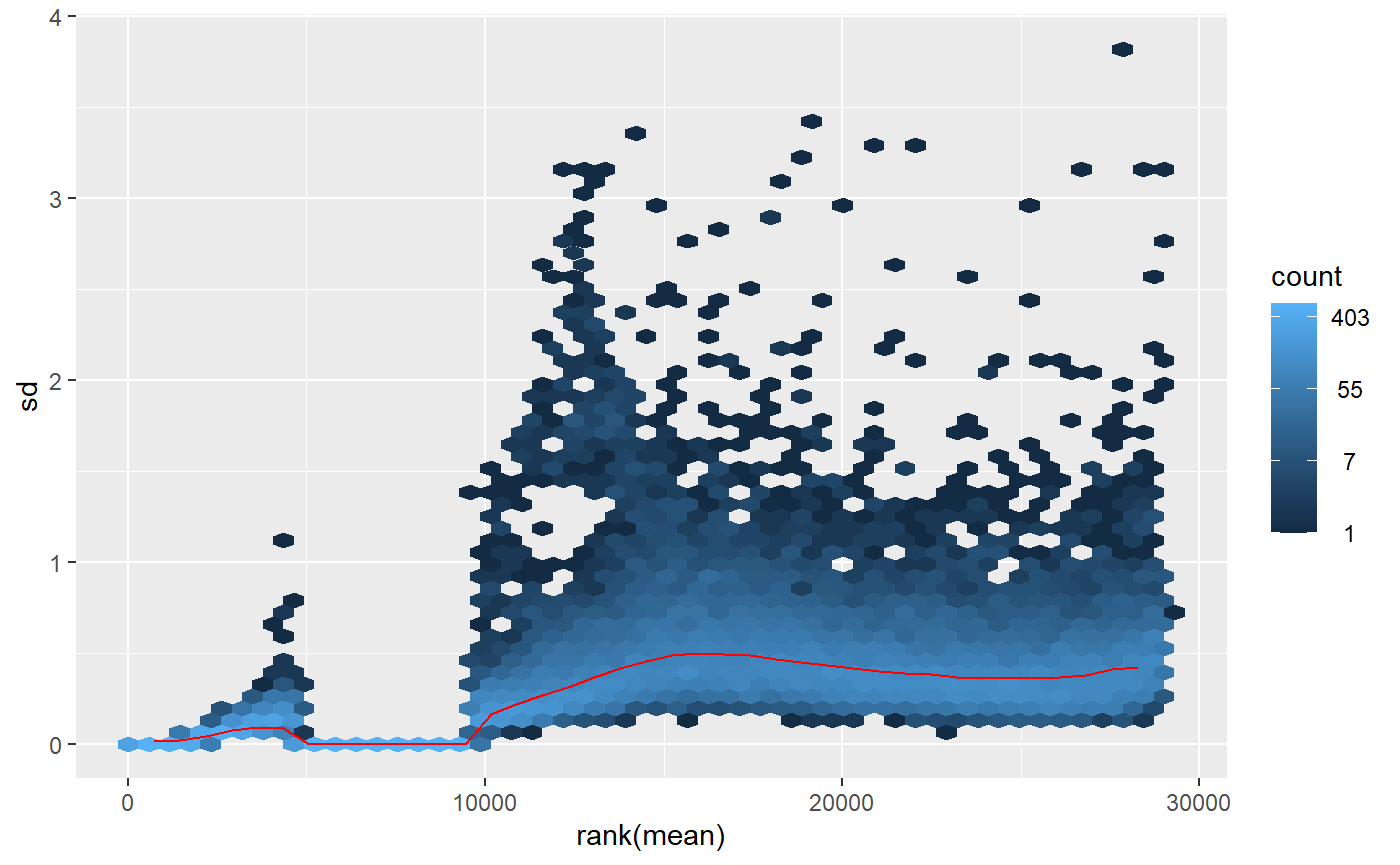
When I apply the _regularized logarithm_ (rlog()) transformation and visualize the meanSdPlot(), I see an irregular pattern around 5000-10000 in the X-axis that I worry could be problematic:
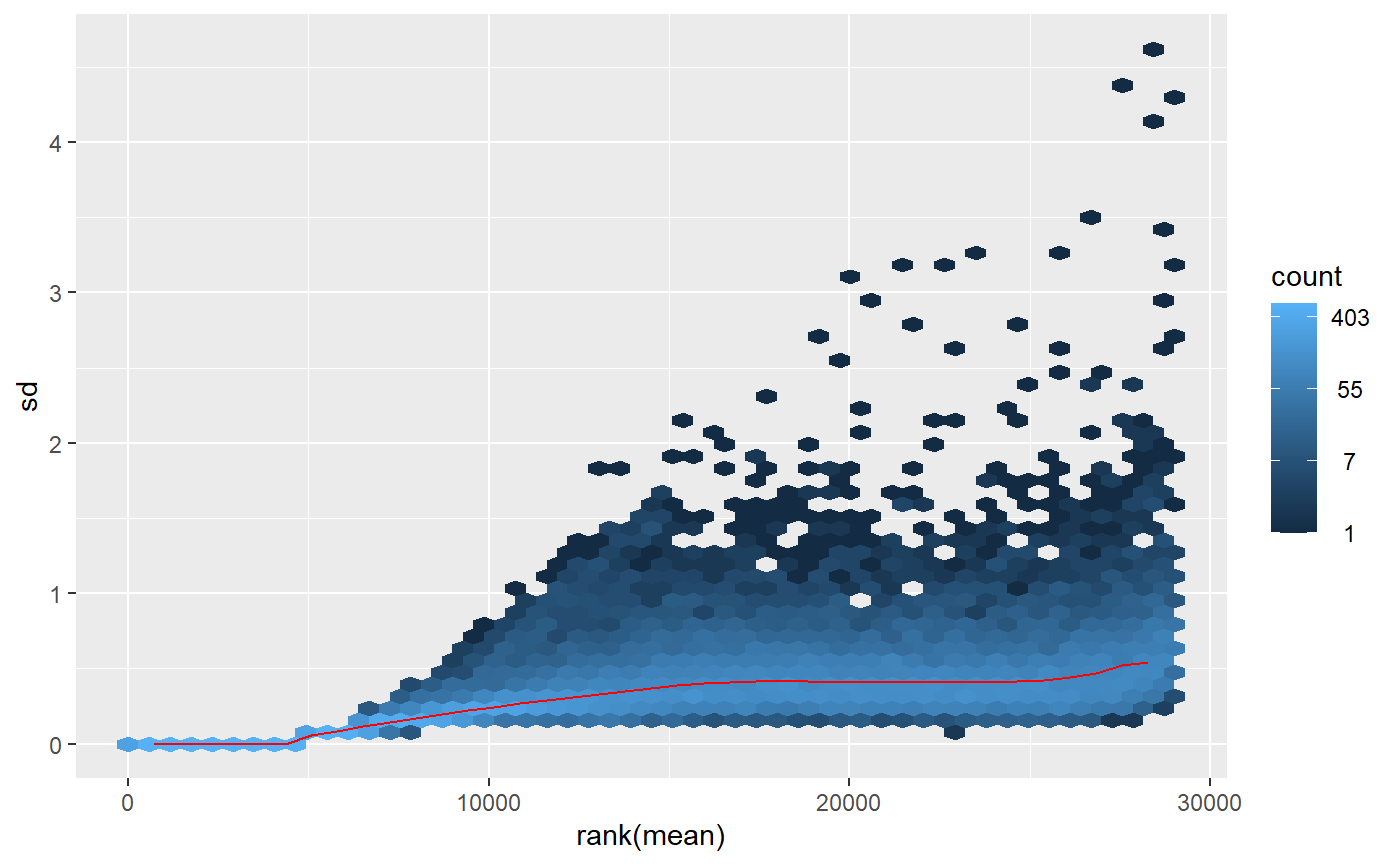
On the other hand, applying the _variance stabilizing_ (vst()) transformation, the plot seems more uniform:
What could be the reason for the strange pattern that comes out of the rlog() transformation and is it something to worry about? I'm particularly intrigued because the two PCAs that come out of those differently transformed data lead me to different conclusions on whether I have outliers in the study or not. With the rlog() transformation it looks like I have an outlier, but with the vst(), it doesn't. Which should I trust?
Any insight or help is appreciated!
Celia


Thank you Michael for your reply.
I'm testing out your solution and, although it does seem to stabilize the rlog transformation, I'm worried I'm removing the very genes that make my outliers outliers. If I understand correctly, your code above removes the genes that have a read count below 10 in at least
xsamples (in my case that is half of the samples because I have 2 equally sized groups). I am working with wild animal samples, so there is a lot of variability - and in many cases I have read counts below the threshold for almost all of the samples except for two or three. With the filter you propose, these genes get removed, but are we losing valuable information there? And am I removing what makes outliers outliers?I guess a solution would be to loosen the filter a bit and allow for more samples to have low counts, but it doesn't seem too precise. I'd love to hear your thoughts on it.
Thanks!
No, it's not valuable information to lose genes with single digit counts, those are below what is possible to detect as DE with typical RNA-seq experiments.