I have miRNA data and I am analyzing it for differential expression using edgeR. The data consists of four different groups (A,B,C,D) that each consist of five replicates.
I have a few miRNAs, that turned out to be differentially expressed, and I would like to make a plot for each individually to show the expression.
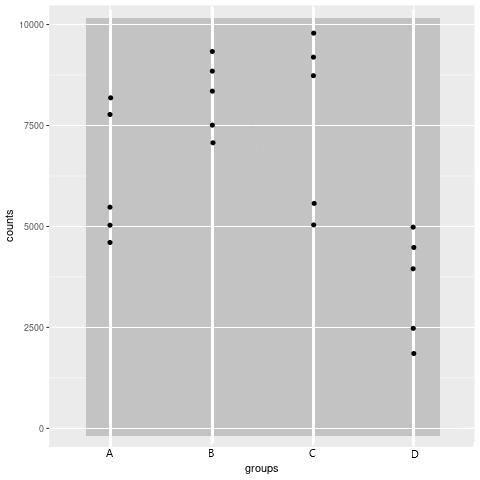
This is the plot that I am currently generating:
Each point stands for one sample (replicate). The y axis displays the count of the miRNA in the sample and the x axis displays the group that the replicate belongs to. Currently, I am just plotting the counts from the dataDGE object that I have used throughout the analysis. (filterByExpr(), calcNormFactors and estimateDisp() have been "applied").
Do I need to apply cpm() to the counts? Is there a better plot type or option to display my results?
mirna = "mirna"
levels = c("A", "B", "C", "D")
plot_data <- data.frame(counts = strtoi(dataDGE$counts[mirna, ]), groups = factor(dataDGE$sample$group, levels = levels))
png(paste("name.pdf"))
p <- ggplot(plot_data) +
geom_point(aes(x = groups,y = counts))
print(p)
dev.off()
Disclaimer: This is not a plot of real data, I randomly inserted some points.


Thank you.
I have changed my code to the following:
`
`
I took those first three lines from this paper: https://f1000research.com/articles/5-1438/v2
The calculated the logCPM counts for displaying a heatmap.
Chen Y, Lun ATL and Smyth GK. From reads to genes to pathways: differential expression analysis of RNA-Seq experiments using Rsubread and the edgeR quasi-likelihood pipeline [version 2; peer review: 5 approved]. F1000Research 2016, 5:1438 (https://doi.org/10.12688/f1000research.8987.2)