Entering edit mode

I am working on the RNA-Seq data of bacterial samples including untreated and 2 drug treatment groups (3 replicates each) following the DESeq2 steps. My question is looking at the dispersion plots including fit type parametric and local, can it be inferred that there is less variability among the genes? Also because the results table also gave about 265 statistically significant genes between the control and treatment 1. It seems that with higher mean counts there is a slight increase in dispersion in the fit type local. Kindly share your feedback on understanding this plot.
Code should be placed in three backticks as shown below
ddsObj<- DESeqDataSetFromMatrix(countData = Raw_counts,colData = sampleinfo,design = ~Condition)
idx <- rowSums(counts(ddsObj) >10 ) >3
table(idx)
ddsObj<-ddsObj[idx,]
dds<-DESeq(ddsObj)
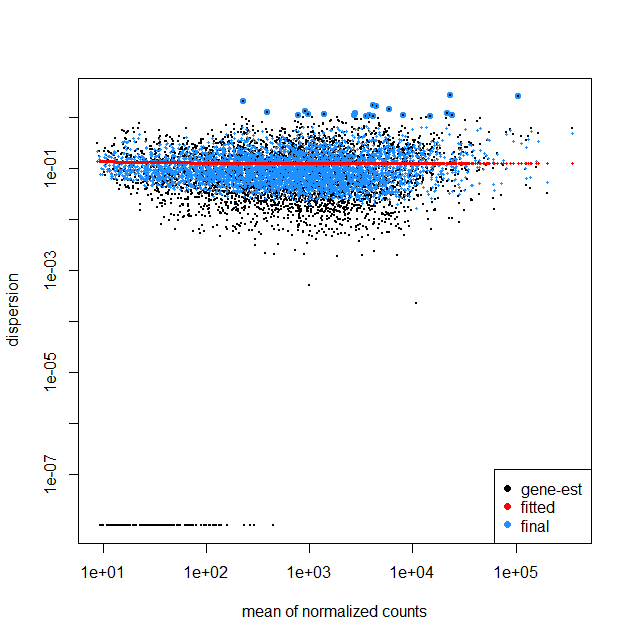
plotDispEsts(dds)
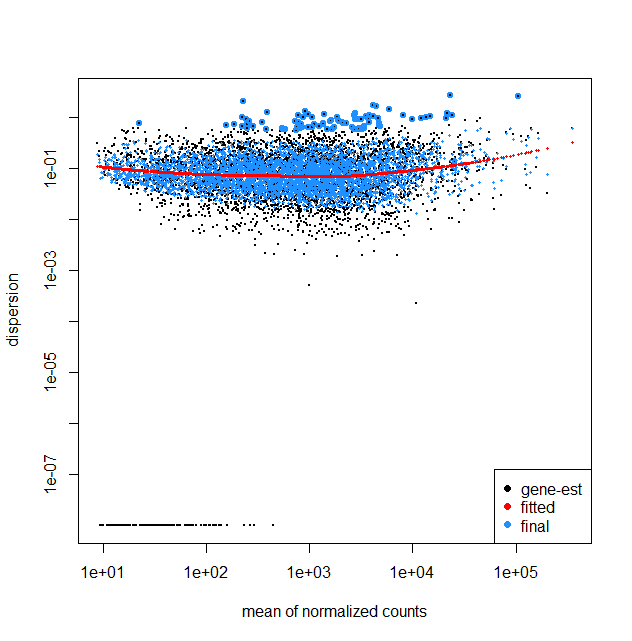
plotDispEsts(dds,fitType = "local")
dds$sizeFactor
res<-results(dds)
res<-res[order(res$padj),]

The fitType argument was mistakenly typed out in the plotDispEsts(). And Thank you for the clarification. I would check more about this.
The plot I have obtained is quite different from other available dispersionEsts plots, where with larger mean normalized counts the dispersion decreases. I would like to ask what could be the reasons that in my plot I do not see such a trend.
It does strike me as odd that for the parametric fitType (top plot) the dispersion estimates are perfectly flat. In this post https://www.seqanswers.com/forum/applications-forums/rna-sequencing/36373-bad-fits-for-deseq-dispersion-estimates?t=41787, Mike Love does mention that "The parametric curve flattens out, which is a good fit for many RNA-Seq datasets but not necessarily for all, hence we provide the local regression."
That said, for your fit with fitType = local, the trend is also almost flat. This does not need to be a problem; the relationship between mean and dispersion will differ depending on the dataset/experiment. E.g., you are working with bacteria, whereas many plots online will display results for mouse/human. One thing to think about, are all 9 samples run in the same batch? If not, a batch variable should be included accordingly in the model, which may also affect the plot (and the analysis as a whole).
That said, I have seen many mean-variance plots that looked considerably worse than yours, so if you are not missing any covariates I would not hesitate to work with this model.
Jeroen
Yes, Thank you for your time and clear explanation.