question about the refined outputs from GOfuncR package
1
0
Entering edit mode
@capricygcapricyg-17892
Last seen 22 months ago
United States

Hi Bioconductor Support,

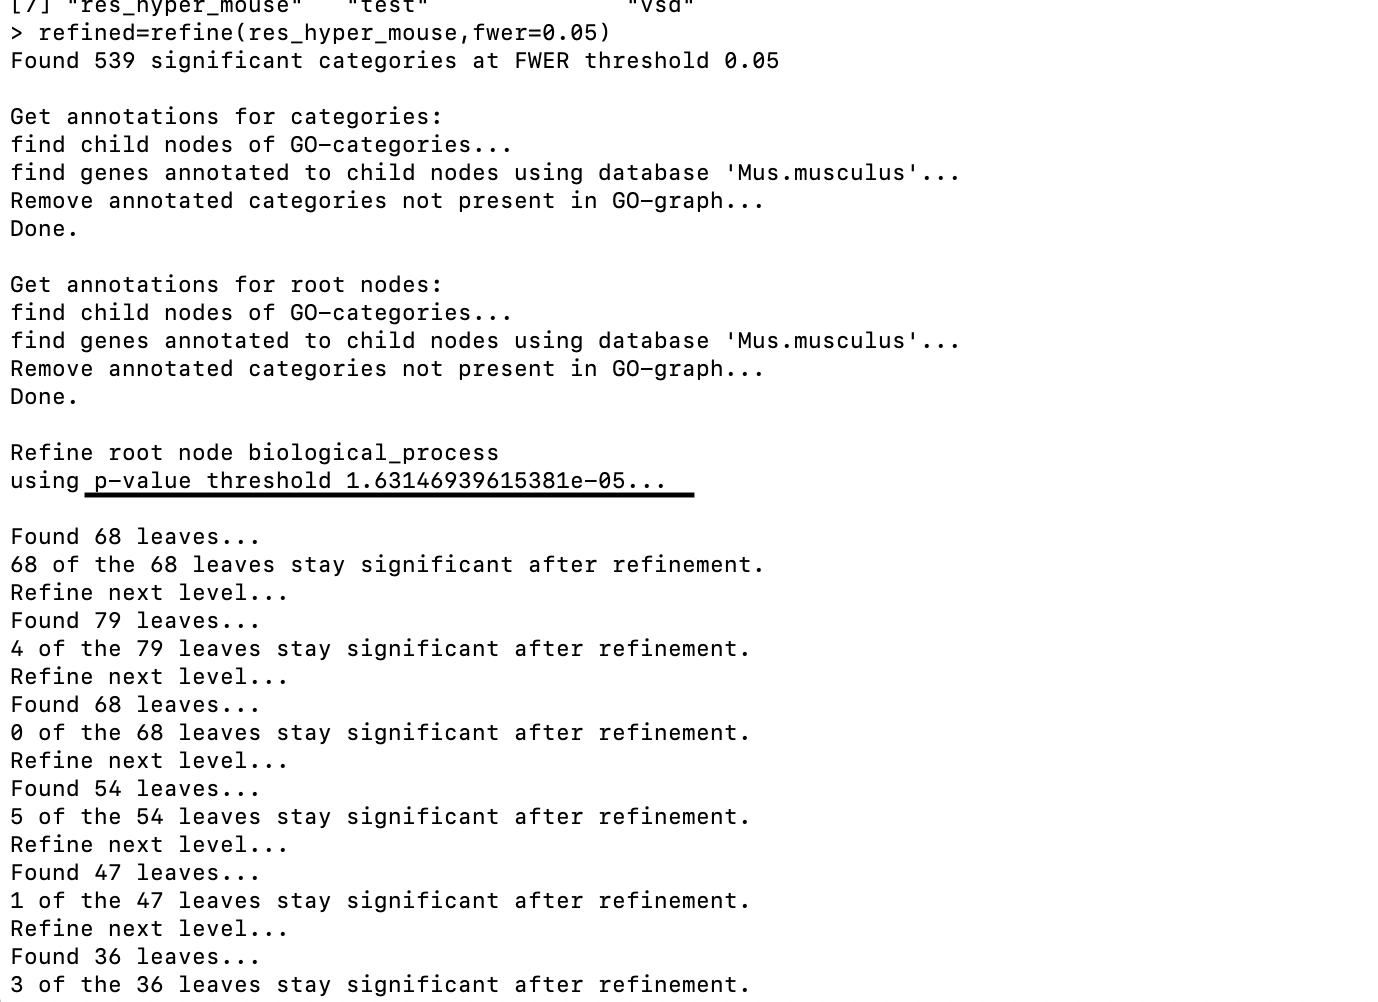
I tried to run the "refine" function from the GOfuncR package and noticed that different GO catetories used different p-value threshold for significance (as shown in the screenshot). My question is: how this threshold was selected? Can I have my own threshold?

Thanks

C.enter image description here


# include your problematic code here with any corresponding output 
# please also include the results of running the following in an R session 

sessionInfo( )
GOfuncR • 871 views
ADD COMMENT
0
Entering edit mode
Steffi Grote ▴ 10
@f67b142b
Last seen 12 weeks ago
Germany, Göttingen

Hi,

the threshold for the significance is based on the FWER, which you can modify using the fwer parameter of the refine function. The p-value that is printed to the console corresponds to this FWER. Since the three GO-domains are analyzed seperately, the same FWER likely corresponds to different p-values for each domain.

The refinement is based to on the p-value and not the FWER, because GO-terms are re-tested for significance after removing genes from significant child-terms (see the elim algorithm as described in Alexa, A. et al. (2006).), and this does not involve a re-calculation of the FWER.

Best, Steffi

ADD COMMENT
0
Entering edit mode

Hi Steffi,

My outputs showed that some of the GO terms had quite different p-values after refinement. May I say those GO terms have many genes removed as child-terms? Is there a way to find what genes were removed actually during the refinement?

Thanks a lot.

C.

ADD REPLY

Login before adding your answer.

Traffic: 564 users visited in the last hour
Help About
FAQ
Access RSS
API
Stats

Use of this site constitutes acceptance of our User Agreement and Privacy Policy.

Powered by the version 2.3.6