Hello,
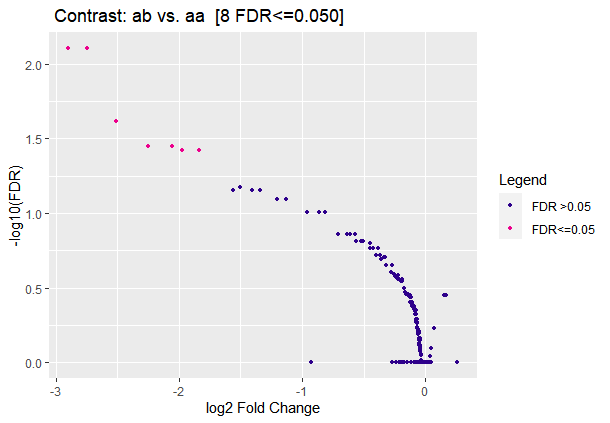
I have ATAC sequencing data for two types of cells, each with three replicates. Get strange results by DiffBind analysis. Why is my volcano map only halfway? I don't know where I went wrong. Is there a problem with the original data or with the processing results? Can anyone answer it. here is my SampleSheet.
last.BAM was compared to the genome.Mitochondrial duplication, PCR duplication and low-quality reads were removed. Paired-ended sequencing to the same chromosome


here is my code
       a <- dba(sampleSheet="diff.csv")
       a <- dba.count(a,bUseSummarizeOverlaps = TRUE)

#warning:In serialize(data, node$con) :
 #'package:stats' may not be available when loading


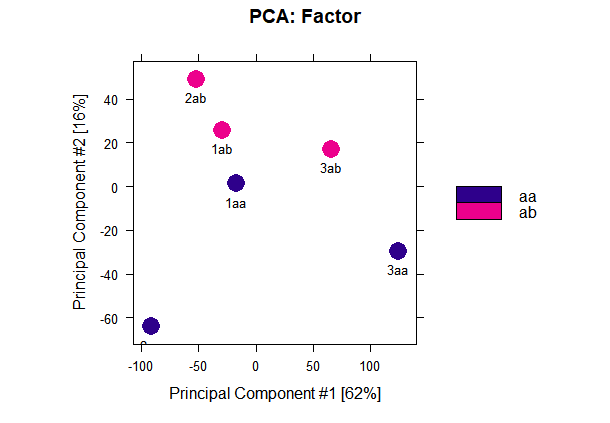
       dba.plotPCA(a,attributes=DBA_FACTOR,label=DBA_ID)
#figure2

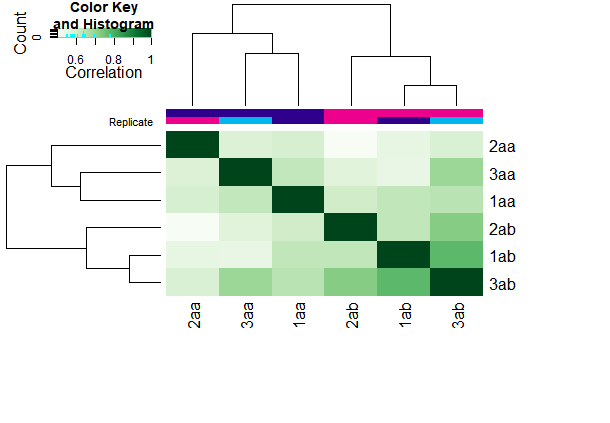
       plot(a)
#figure3

       a <- dba.contrast(a,categories = DBA_FACTOR,minMembers = 2)
       a <- dba.analyze(a,method=DBA_DESEQ2)
#warning: solve(): system is singular (rcond: 3.89123e-18); attempting approx solution

       dba.show(a,bContrasts = T)
#  Factor Group Samples Group2 Samples2 DB.DESeq2
# 1 Factor    ab       3     aa        3         8

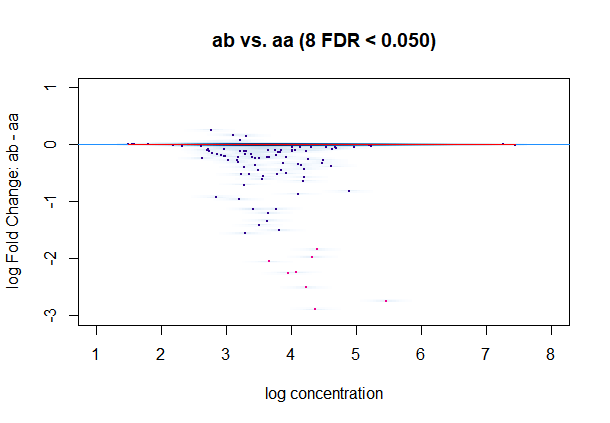
       dba.plotMA(a)
#warning:In KernSmooth::bkde2D(x, bandwidth = bandwidth, gridsize = nbin,  :Binning grid too coarse for current (small) bandwidth: consider increasing 'gridsize'

#figure4

#This picture is weird.

       dba.plotVolcano(a)

#figure5


sessionInfo( )


