Dear Bio Communities,
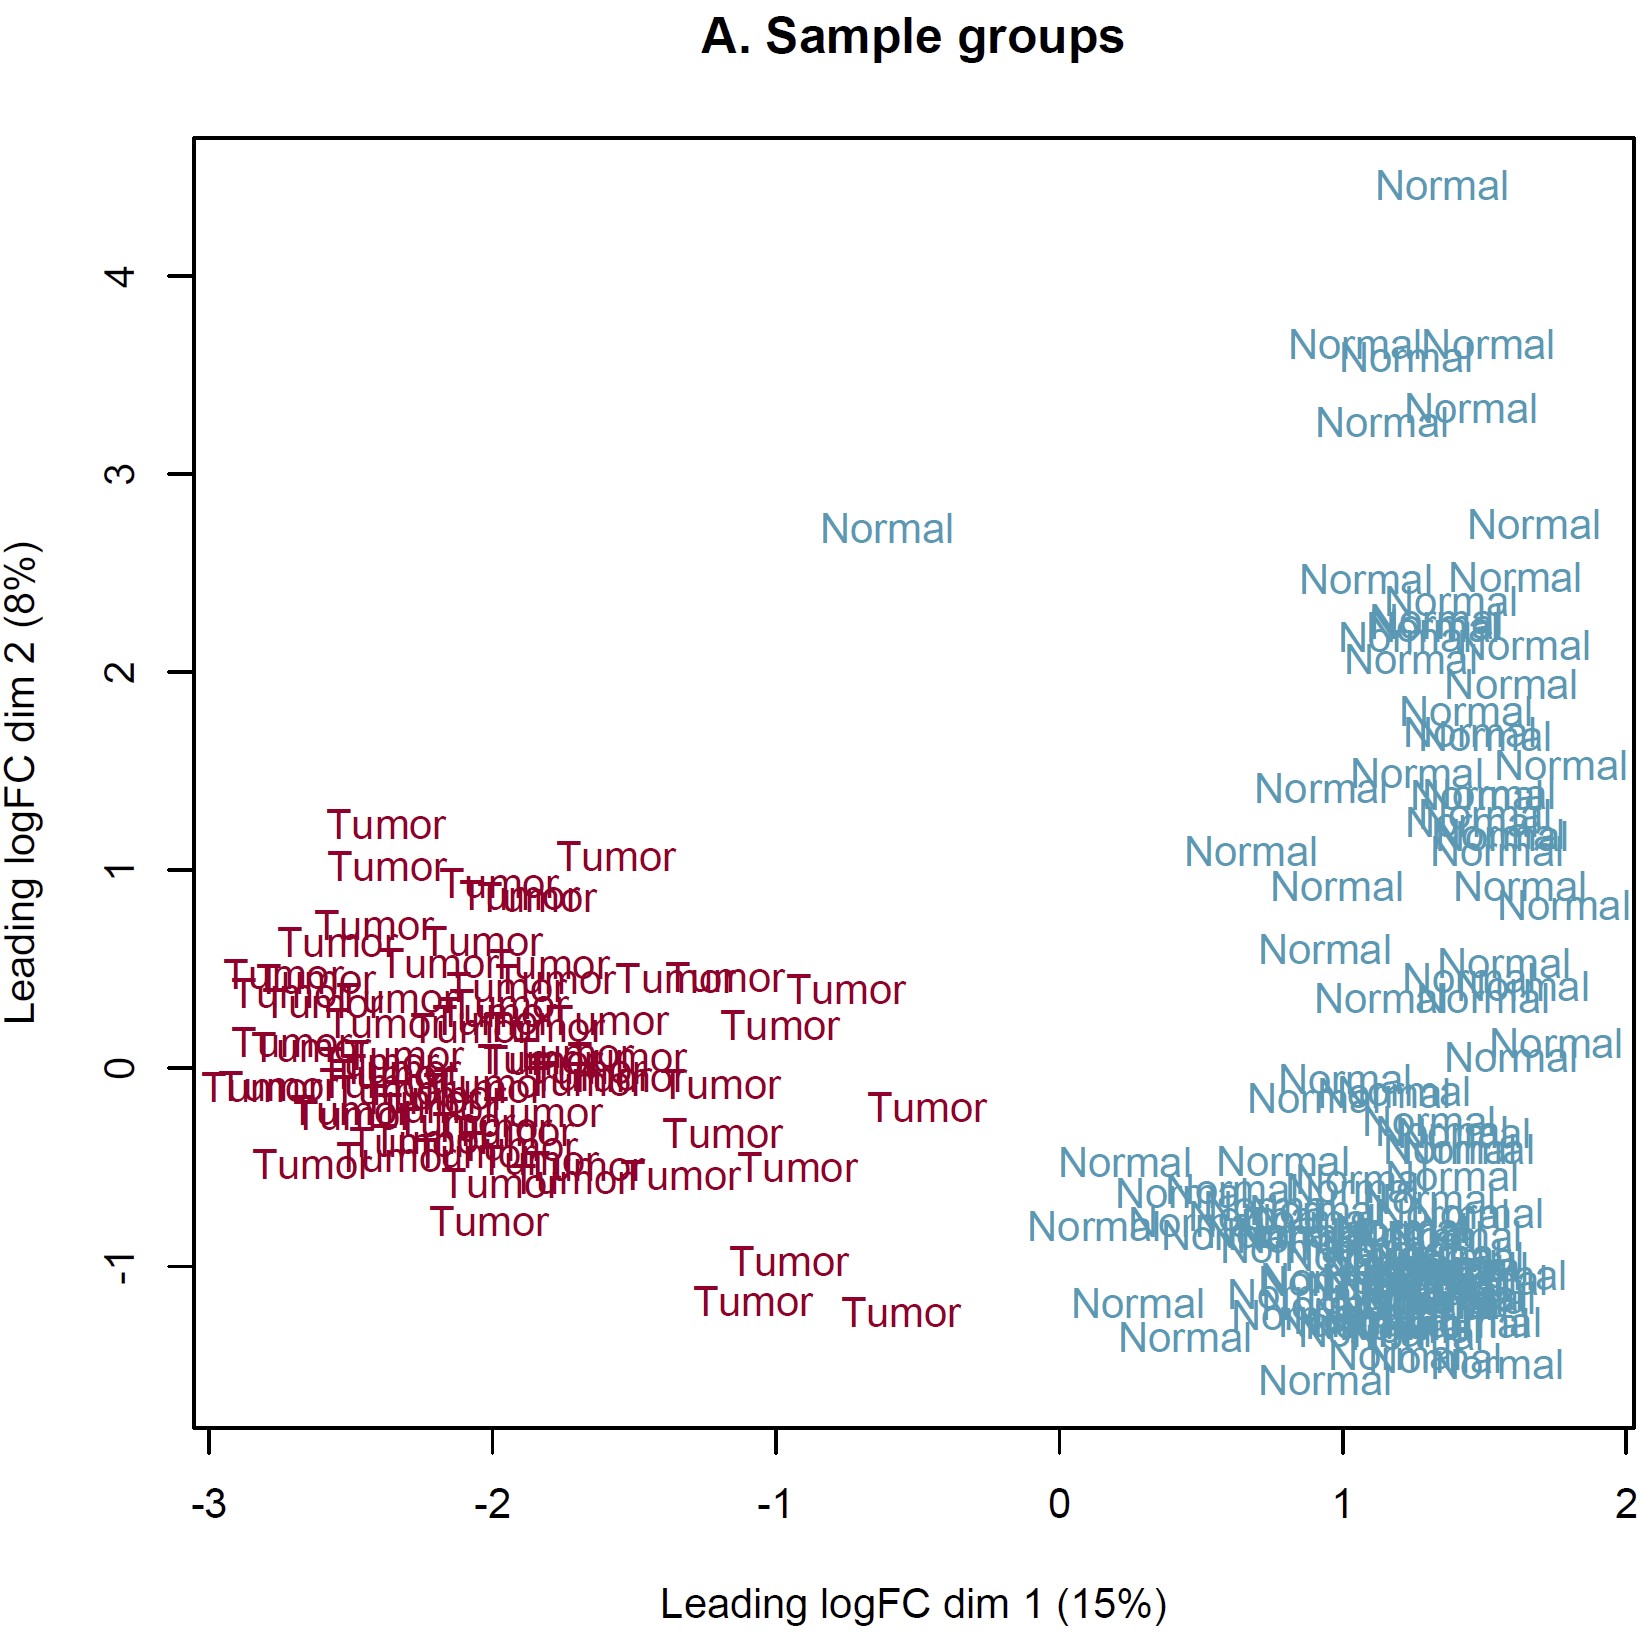
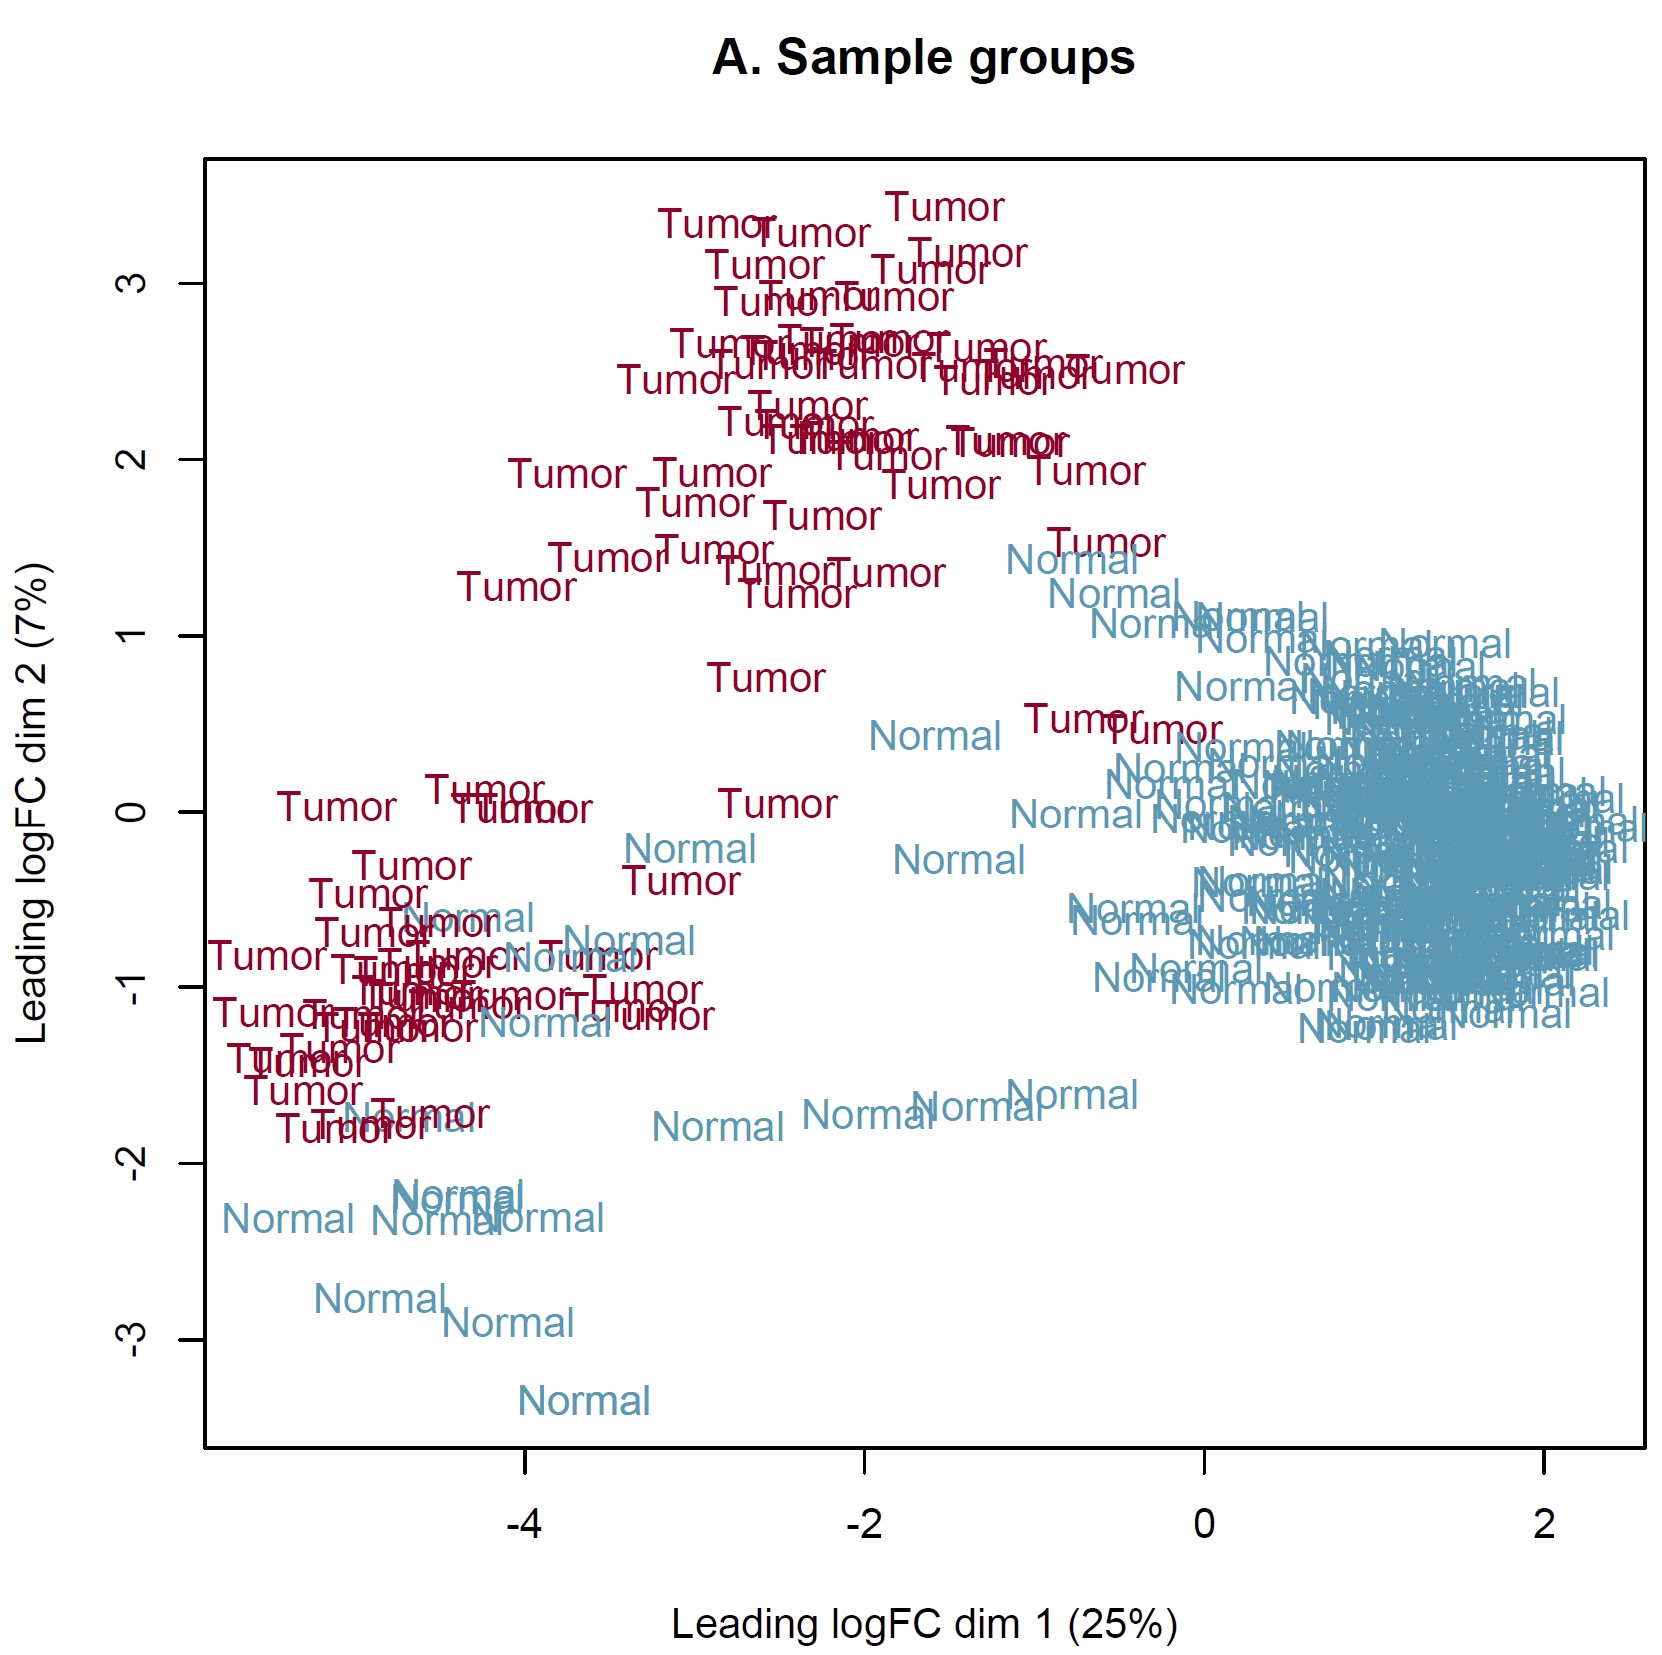
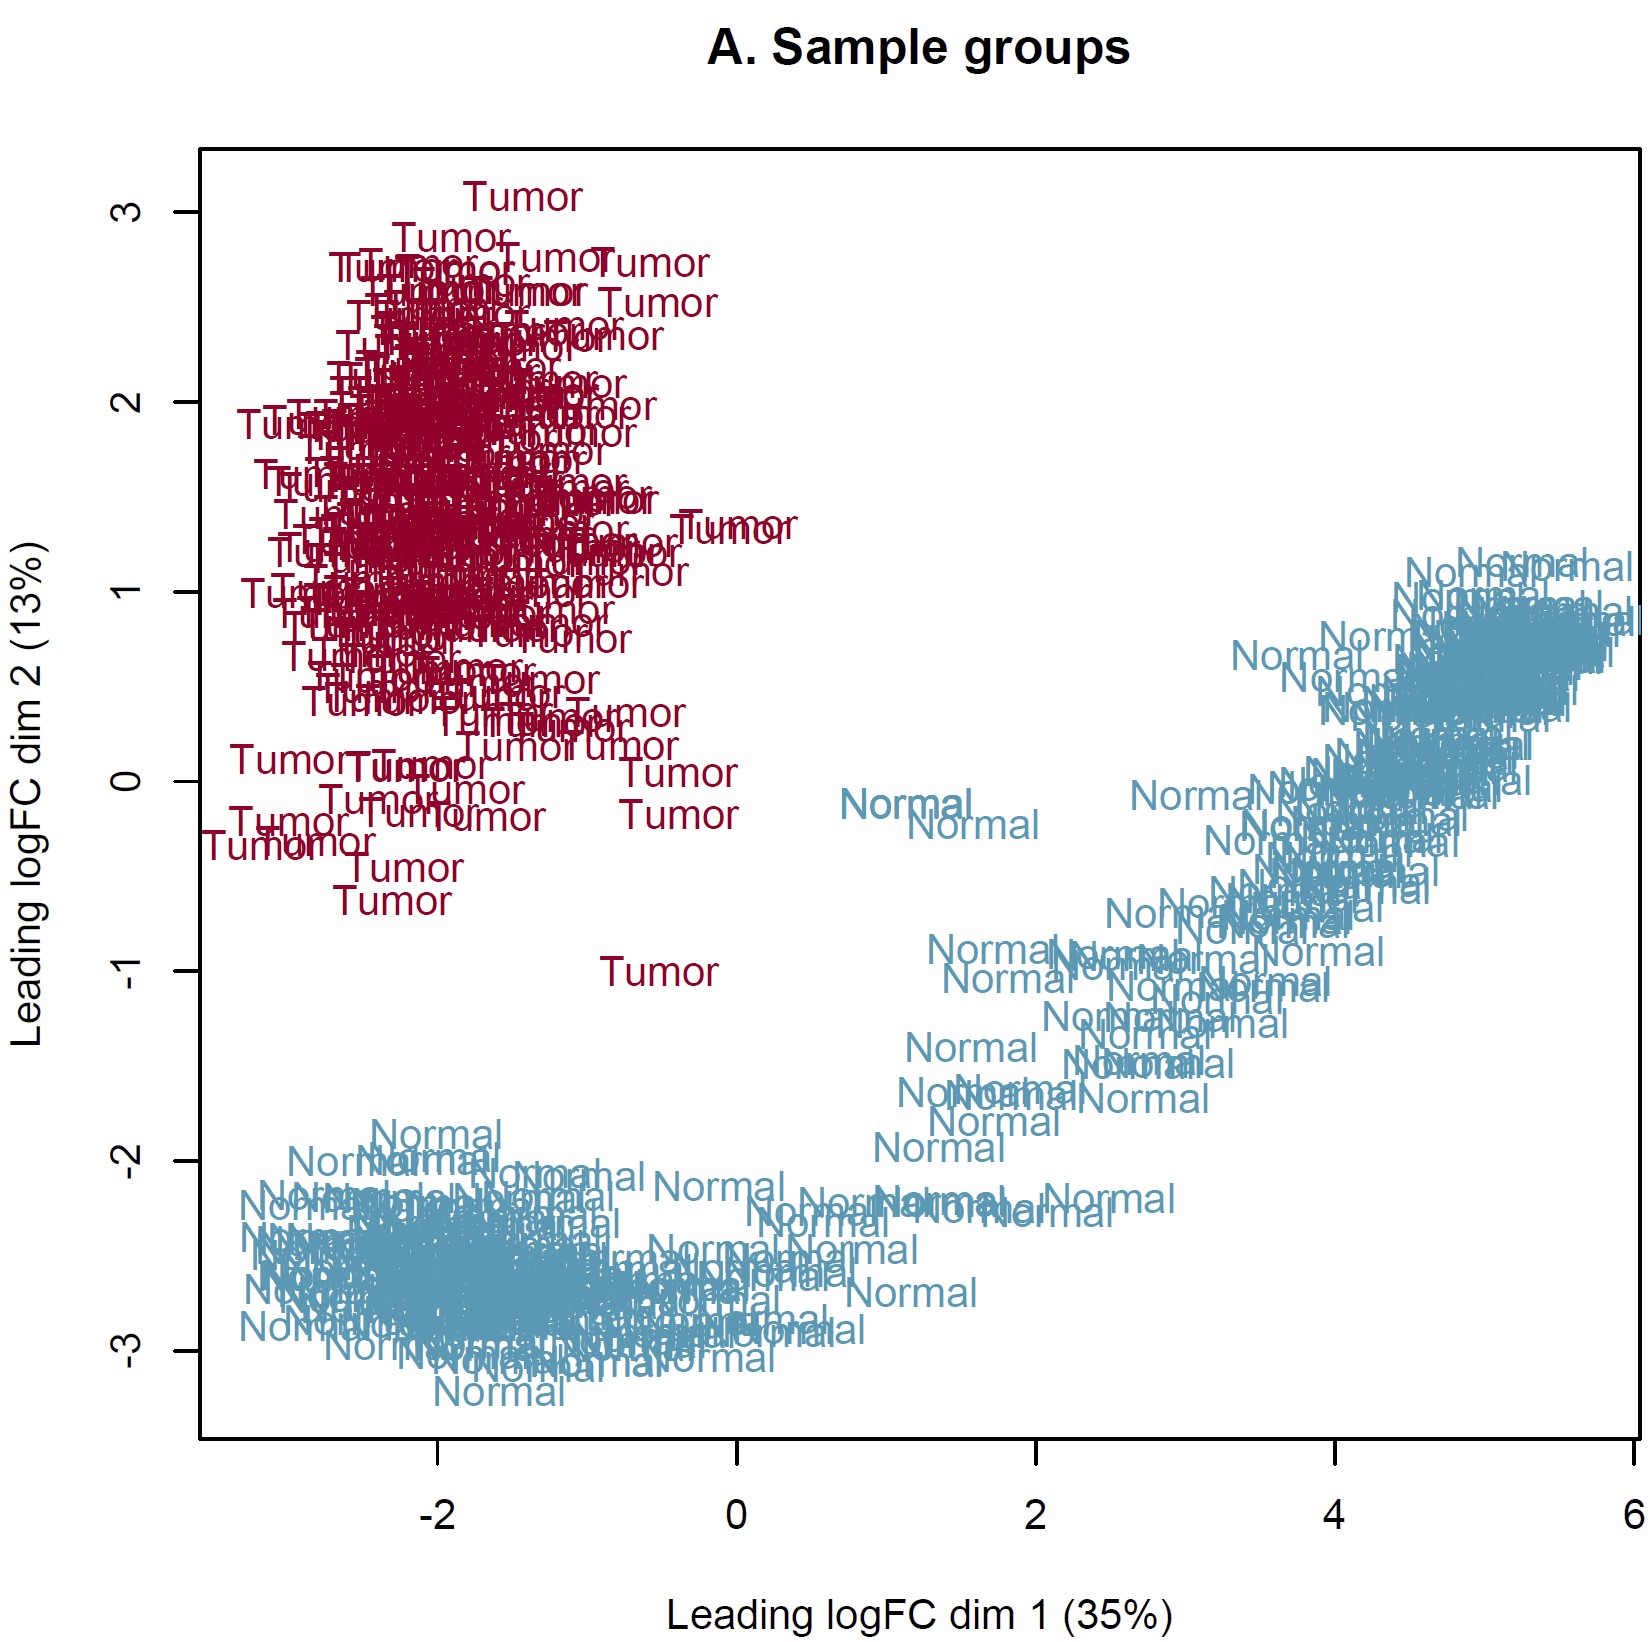
DEG analysis was conducted by limma::voom based on the combined expected count data of TCGA and GTEX. However, the MDS plot show something somewhat unreason which I think. IMO, the heterogeneity of tumor should more obvious than normal tissue. Should I perform DEG analysis based on these sample? How can I judge these samples by MDS plot and what is the criteria? Thanks in advance!


Thanks for your reply sir! IMO, the batch effect can not be completely removed by arithmetic methods only event though the batch corrected datasets were used (RSEM expected_count,https://xenabrowser.net/datapages/?dataset=TcgaTargetGtex_gene_expected_count&host=https%3A%2F%2Ftoil.xenahubs.net&removeHub=https%3A%2F%2Fxena.treehouse.gi.ucsc.edu%3A443). The reason why GTEX normal tissues were utilized for counterpart to TCGA tumor is the limited normal sample size of TCGA. So I wonder is there something I can do to make it more reasonable to use these combined datasets? Like add parameter "normalize.method" of voom function? Thanks too much!