Hi there, I am using Deseq2 to perform DE analysis between disease group and control from RNAseq data, since I learned from this tutorial that low-count genes can impact false positives in the multiple testing correction so pre-filtering is advised: https://www.bioconductor.org/packages/release/workflows/vignettes/rnaseqGene/inst/doc/rnaseqGene.html#using-sva-with-deseq2. But I am a bit confused about the DEGs I got after I used 4 different filtering criterions, these DEGs overlap with each other to some extent, but also have some difference with each other. So I have two following questions:
- Is it better that I should only use the common DEGs shared by different filtering strategies, because these common DEGs seem quite robust across different filtering strategies?
- Where do those non-overlapping DEGs come from? Does it indicate that Deseq2 has generated some false positives in the GLM model fitting process? One thing to mention here is that I have about 60 samples for each of the two conditions I am comparing, is it likely that 60 samples would lead to large within-group variance thus a single NB model for each condition is not applicable any more, so Deseq2 generates some false positive results? Any other suggestions? Thank you for your comments!
The four different filtering strategies are as follows:
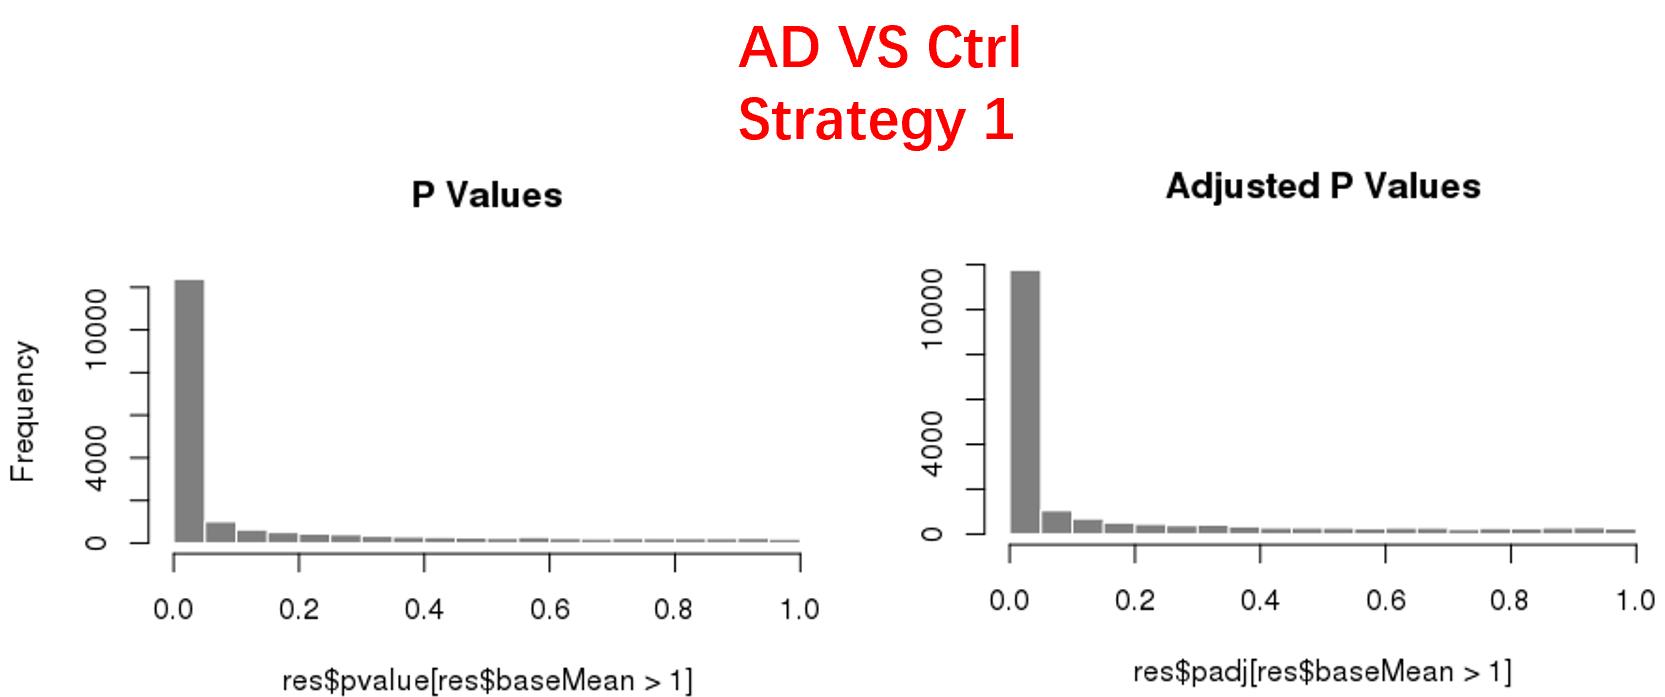
strategy 1: Keep genes express larger than 50 in at least 8 samples, 18819 genes remained;
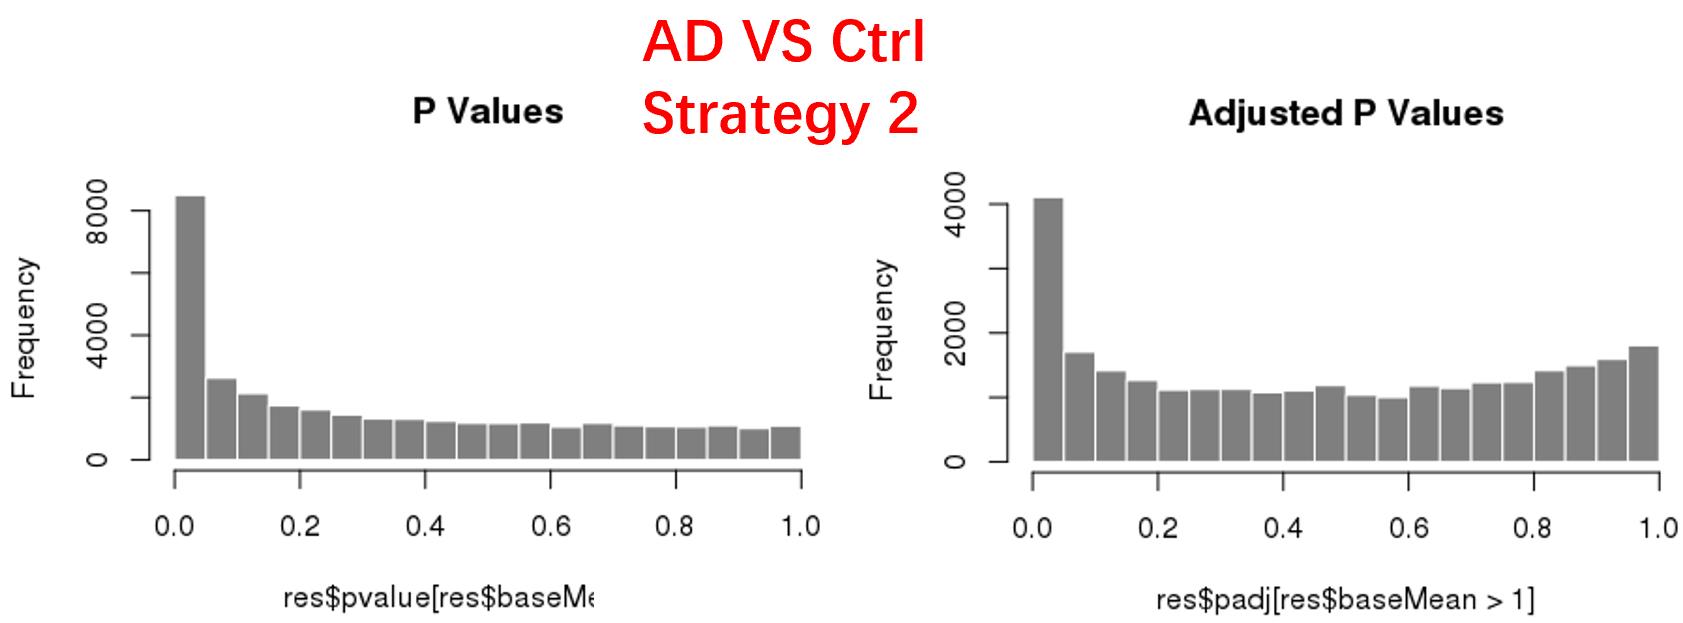
strategy 2: Keep genes express larger than 1 in at least 1 samples, 47826 genes remained;
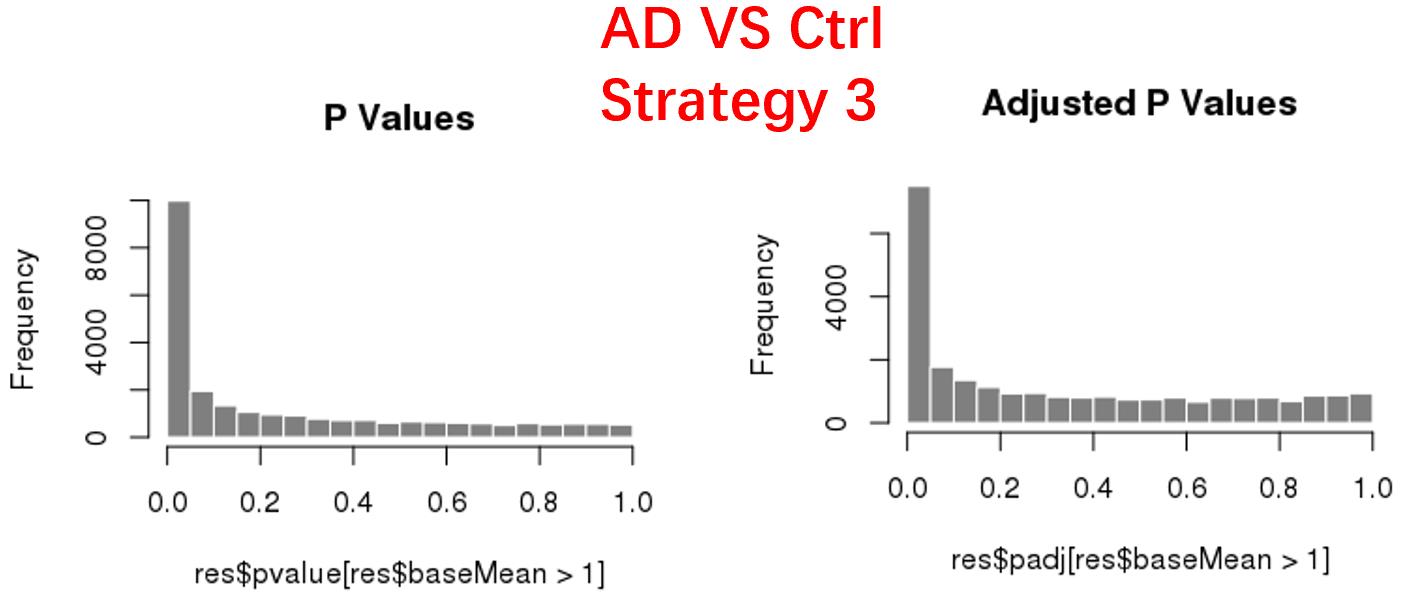
strategy 3: Keep genes express larger than 20 in at least 3 samples, 24669 genes remained;
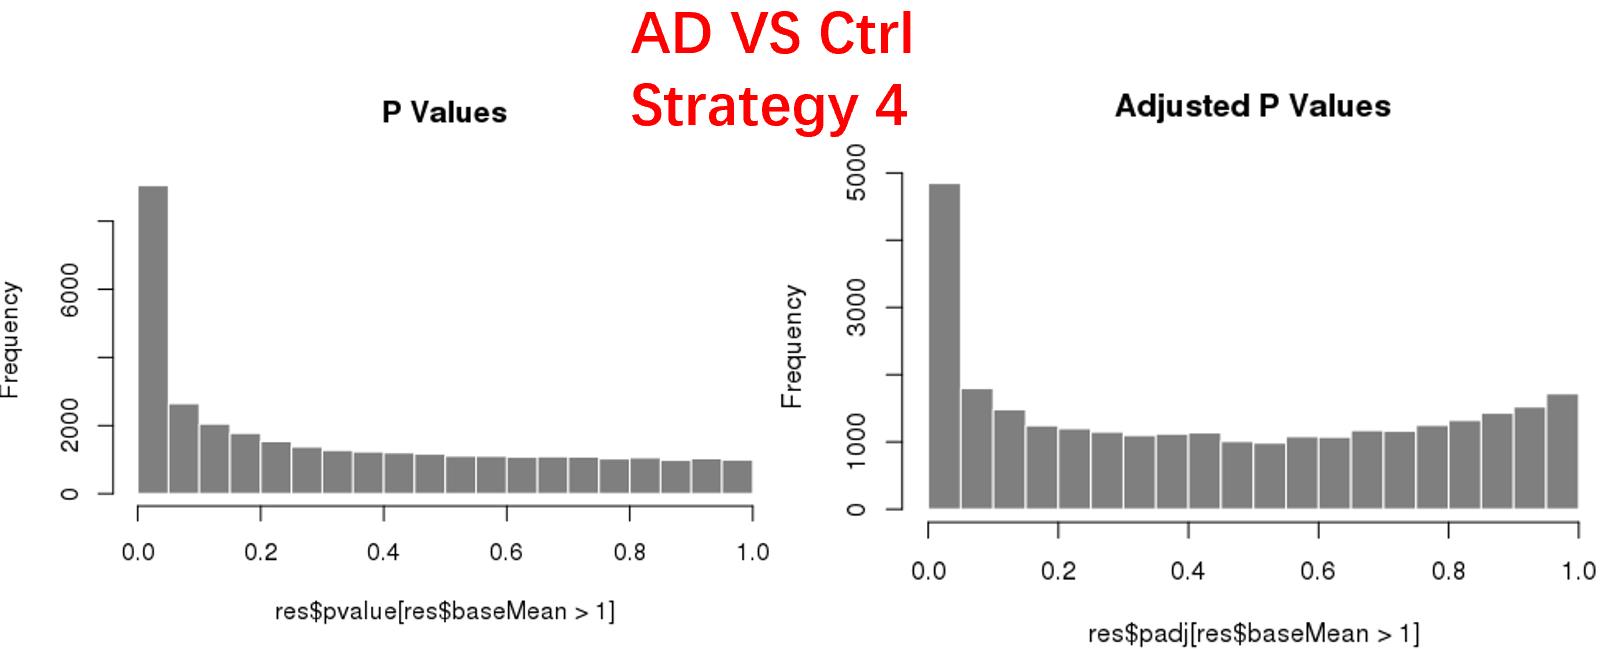
strategy 4: Keep genes express larger than 5 in at least 3 samples, 34878 genes remained;
As follows are the pvalue distribution of the above 4 strategies, which you could also indicate the number of significant DEGs, and the relative abundance of Up/Down DEGs are nearly the same.
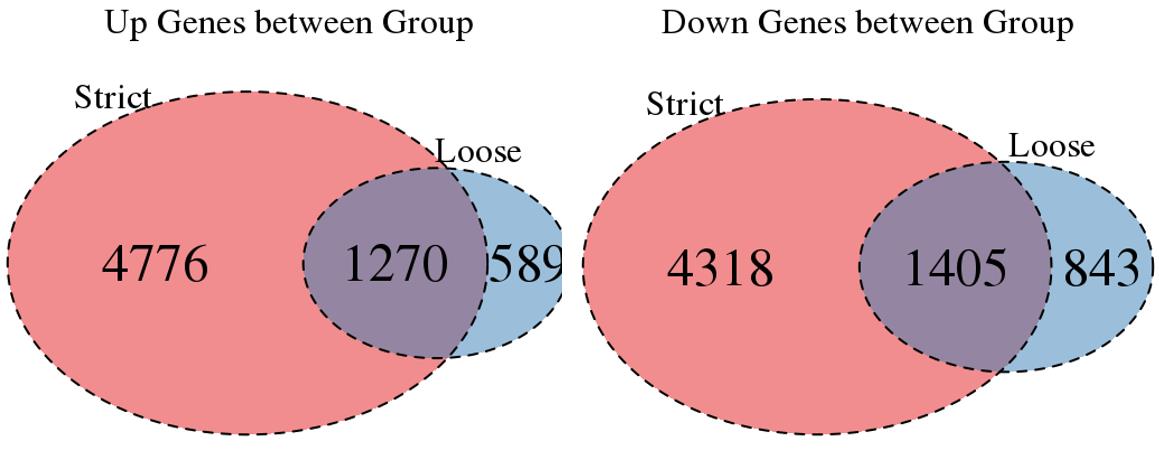
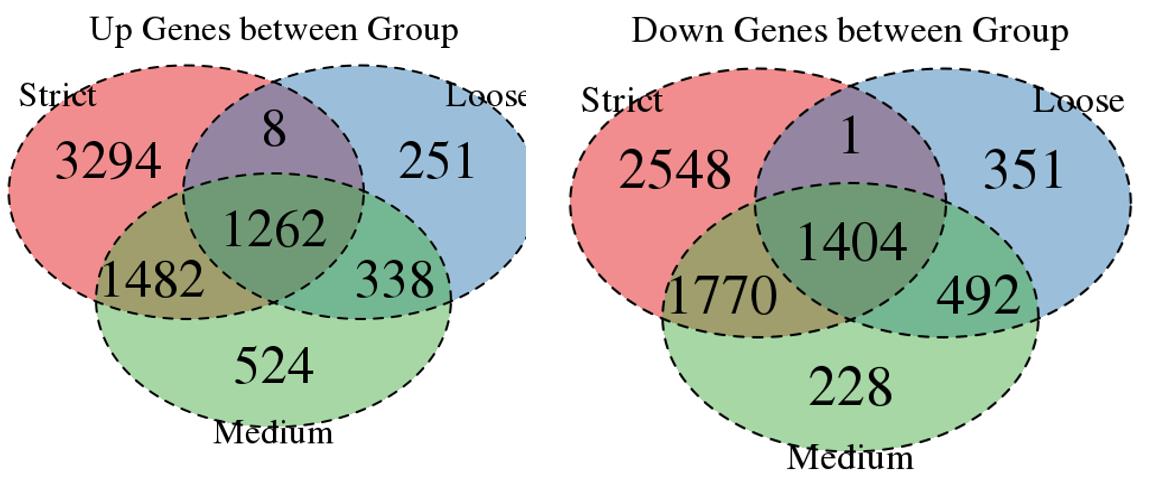
For the Up/Down DEGs I got from the above 4 filtering strategies, I used Venn plot to show the overlapping and non-overlapping set of genes. As you could see, the common DEGs are quite robust, but there are still many genes that are unique for each strategy.
Venn plot for common DEGs between strategy 1 and 2:
Venn plot for common DEGs between strategy 1, 2 and 3:
Venn plot for common DEGs among all four strategies:
Codes are basic workflows from Deseq2 comparing disease group versus ctrl, except different number of genes are pre-filtered before forming a Deseq2 dds object, DEGs are treated as p-adj < 0.05.
# include your problematic code here with any corresponding output
# please also include the results of running the following in an R session

sessionInfo( )



Hi Michael, Thanks a lot for your comment, yes I saw a sequencing batch effect from PCA plot, and also used SVA to account for all other unknown effects, so my final model design roughly looks like this : ~ group + batch + SV1 + SV2 (where SV1/2 are the top 2 surrogate variables from SVA analysis). My prefiltering code is similar to your code: keep <- rowSums(counts(dds) >= y) >= x dds <- dds[keep,] And I would try the threshold you suggest, but could you also comment why there are different unique DEGs after different prefiltering strategies? Are they likely to be false positives indicating the negative binomial model (one single dispersion parameter) is not accurate for large sample size for some genes? And is it reasonable to use the common DEGs shared by different prefiltering strategies since this set of genes is quite robust? Thanks!
In some datasets, one type of positive I have seen is data that isn't NB within one group, it's half zeros and then a few very high counts. So the E(Y) is actually different across groups, but it's also maybe not as interesting as a gene that is consistently expressed, and has a shift in E(Y). So filtering the genes that have majority zero counts prioritizes a different set. Furthermore, removing those spiky genes can lower the global dispersion estimates, so increasing power.
Hi Michael, thanks a lot for the comment and this answer really helps a lot. One more thing, my actual model design is : sex + brain_region + group + age + batch + SV1 + SV2, although the total number of samples is ~120 (60 samples per group), but if you combine the specific sex with specific brain_region and group, the sample size for one condition (male with region 1 with disease group) is ~8, so do you think for the prefiltering threshold: keep <- rowSums(counts(dds) >= 10) >= X, should X be 30? or 4? Thanks!
I would use the sample size of the biological groups of interest, don't include the technical variables for picking X.
Thanks a lot!