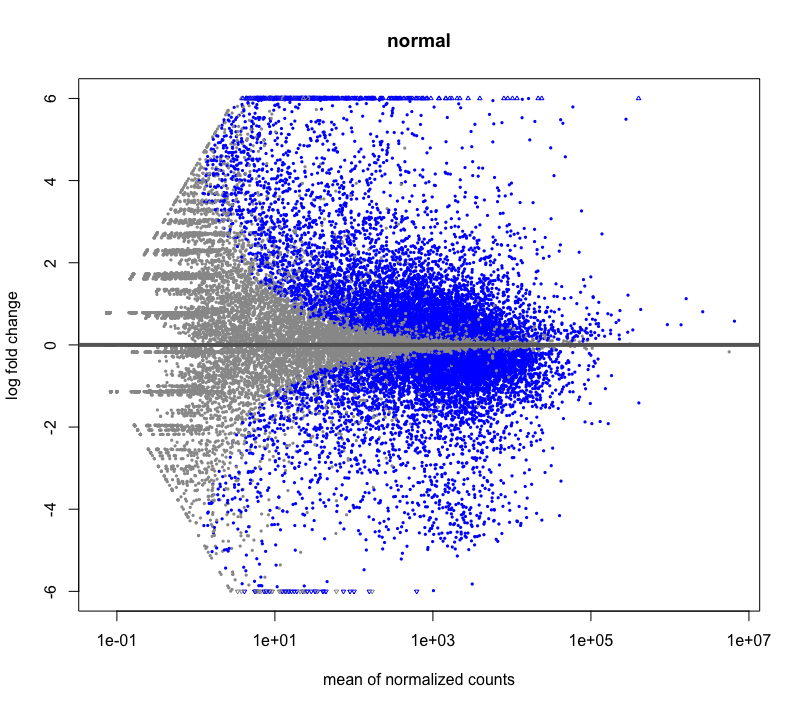
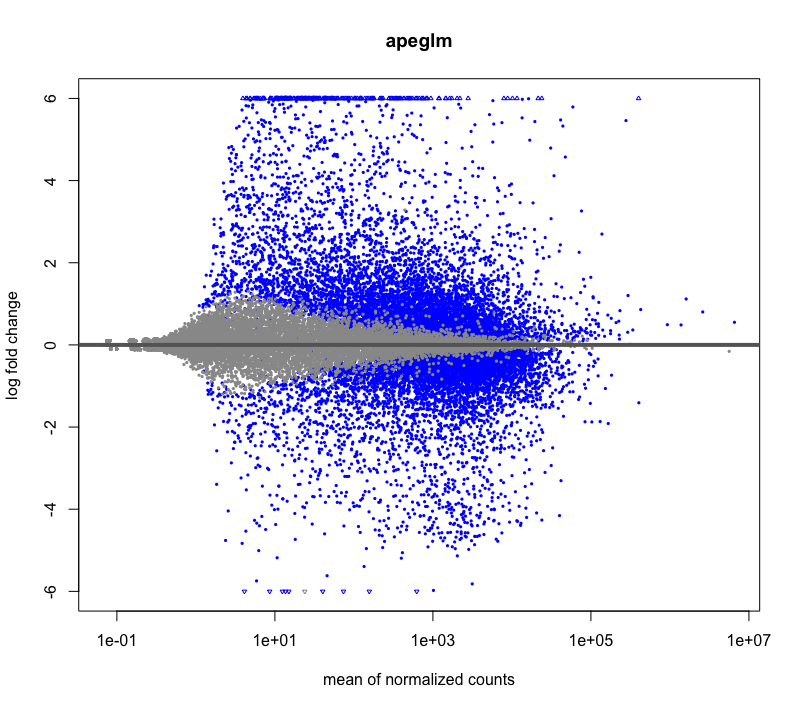
Hi, I have a question about DESeq2 LFCshrinkage: Is it possible that some genes have a slightly higher LFC after shrinkage? It happened during my RNAseq DE analysis, I have very deeply sequenced samples with large base means. I tried visualizing using MAplot check, and it looks fine. I'm mainly just curious why it could be happening.
Thank you very much!

Before shrinkage
gene_name gene_biotype baseMean log2FoldChange lfcSE stat pvalue padj
Man2b1 protein_coding 13964.1811689668 1.14901659101663 0.026320542427396 43.6547458771468 0 0
Acsl1 protein_coding 12428.1198150372 -1.19203974862738 0.0309164869284314 -38.5567658895669 0 0
Lpar1 protein_coding 10110.7963562404 -1.2202928328298 0.0304299001078297 -40.1017692633114 0 0
Plbd2 protein_coding 11931.1301365076 1.3739819601851 0.0319518259803669 43.0016726126813 0 0
Colgalt1 protein_coding 20463.1536063121 -1.41111184542647 0.0360342333779327 -39.1603126567592 0 0
Pld3 protein_coding 10409.4761223403 1.45876217014098 0.0342221971577909 42.6261985288365 0 0
Serpinh1 protein_coding 130803.363492491 -1.60180488761581 0.038333572697764 -41.7859535359521 0 0
Itm2c protein_coding 16741.2345729904 1.61533171987466 0.0363497339741802 44.4386118760058 0 0
Fam20c protein_coding 31312.9603458304 1.66573800250627 0.0356904438344024 46.6718209007153 0 0
Arl6ip5 protein_coding 6917.92975304822 1.99977697101572 0.049957690177568 40.029412166731 0 0
Ctsa protein_coding 19094.5177324866 2.01155711378371 0.0450333903613202 44.668125087723 0 0
Aplp1 protein_coding 6144.4413345581 2.03447790224768 0.0423078628847808 48.0874656275663 0 0
After shrinkage
gene_name gene_biotype baseMean log2FoldChange lfcSE pvalue padj
Man2b1 protein_coding 13964.1811689668 1.15088428333462 0.0263176482387476 0 0
Acsl1 protein_coding 12428.1198150372 -1.1904574704259 0.0309164525315082 0 0
Lpar1 protein_coding 10110.7963562404 -1.21964450839398 0.0304314704060129 0 0
Plbd2 protein_coding 11931.1301365076 1.37367794538455 0.0319515611635686 0 0
Colgalt1 protein_coding 20463.1536063121 -1.40983149622625 0.0360380229694581 0 0
Pld3 protein_coding 10409.4761223403 1.45774280936718 0.0342249709778493 0 0
Serpinh1 protein_coding 130803.363492491 -1.60093511162113 0.0383282083050976 0 0
Itm2c protein_coding 16741.2345729904 1.61350967070109 0.0363573760545177 0 0
Fam20c protein_coding 31312.9603458304 1.66751229278783 0.0356897852459903 0 0
Arl6ip5 protein_coding 6917.92975304822 1.99771245849146 0.0499730301660154 0 0
Ctsa protein_coding 19094.5177324866 2.01001220283617 0.0450386387713646 0 0
Aplp1 protein_coding 6144.4413345581 2.03381754211172 0.0423164419717999 0 0
> condsToCompare
[1] "CTRL" "24h"

res<-results(dds, contrast=c("condition", condsToCompare[2], condsToCompare[1]))


resLFC <- lfcShrink(dds, coef = "condition_24h_vs_CTRL", type="apeglm")


sessionInfo()
R version 4.0.4 (2021-02-15)
Platform: x86_64-apple-darwin17.0 (64-bit)
Running under: macOS 12.3

Matrix products: default
LAPACK: /Library/Frameworks/R.framework/Versions/4.0/Resources/lib/libRlapack.dylib

locale:
[1] en_US.UTF-8/en_US.UTF-8/en_US.UTF-8/C/en_US.UTF-8/en_US.UTF-8

attached base packages:
[1] parallel  stats4    stats     graphics  grDevices utils     datasets  methods   base

other attached packages:
 [1] tidyr_1.2.0                 edgeR_3.32.1                limma_3.46.0
 [4] data.table_1.14.2           biomaRt_2.50.1              tximport_1.18.0
 [7] dendsort_0.3.4              pheatmap_1.0.12             ggpubr_0.4.0
[10] openxlsx_4.2.5              EnhancedVolcano_1.8.0       PCAtools_2.2.0
[13] ggrepel_0.9.1               gplots_3.1.1                DESeq2_1.30.1
[16] SummarizedExperiment_1.20.0 Biobase_2.50.0              MatrixGenerics_1.2.1
[19] matrixStats_0.61.0          GenomicRanges_1.42.0        GenomeInfoDb_1.26.7
[22] IRanges_2.24.1              S4Vectors_0.28.1            BiocGenerics_0.36.1
[25] dplyr_1.0.8                 magrittr_2.0.3              ggplot2_3.3.5
[28] RColorBrewer_1.1-3          BiocManager_1.30.16

loaded via a namespace (and not attached):
  [1] ggbeeswarm_0.6.0          colorspace_2.0-3          ggsignif_0.6.3            ellipsis_0.3.2
  [5] XVector_0.30.0            rstudioapi_0.13           farver_2.1.0              bit64_4.0.5
  [9] mvtnorm_1.1-3             apeglm_1.12.0             AnnotationDbi_1.52.0      fansi_1.0.3
 [13] xml2_1.3.3                splines_4.0.4             sparseMatrixStats_1.2.1   extrafont_0.18
 [17] cachem_1.0.6              geneplotter_1.68.0        broom_0.7.12              Rttf2pt1_1.3.10
 [21] annotate_1.68.0           dbplyr_2.1.1              readr_2.1.2               compiler_4.0.4
 [25] httr_1.4.2                dqrng_0.3.0               backports_1.4.1           assertthat_0.2.1
 [29] Matrix_1.4-1              fastmap_1.1.0             cli_3.2.0                 BiocSingular_1.6.0
 [33] prettyunits_1.1.1         tools_4.0.4               rsvd_1.0.5                coda_0.19-4
 [37] gtable_0.3.0              glue_1.6.2                GenomeInfoDbData_1.2.4    reshape2_1.4.4
 [41] rappdirs_0.3.3            maps_3.4.0                Rcpp_1.0.8.3              bbmle_1.0.24
 [45] carData_3.0-5             Biostrings_2.58.0         vctrs_0.4.0               ggalt_0.4.0
 [49] extrafontdb_1.0           DelayedMatrixStats_1.12.3 stringr_1.4.0             beachmat_2.6.4
 [53] lifecycle_1.0.1           irlba_2.3.5               gtools_3.9.2              rstatix_0.7.0
 [57] XML_3.99-0.9              zlibbioc_1.36.0           MASS_7.3-56               scales_1.1.1
 [61] vroom_1.5.7               hms_1.1.1                 proj4_1.0-11              curl_4.3.2
 [65] memoise_2.0.1             ggrastr_1.0.1             emdbook_1.3.12            bdsmatrix_1.3-4
 [69] stringi_1.7.6             RSQLite_2.2.12            genefilter_1.72.1         caTools_1.18.2
 [73] zip_2.2.0                 BiocParallel_1.24.1       rlang_1.0.2               pkgconfig_2.0.3
 [77] bitops_1.0-7              lattice_0.20-45           purrr_0.3.4               labeling_0.4.2
 [81] cowplot_1.1.1             bit_4.0.4                 tidyselect_1.1.2          plyr_1.8.7
 [85] R6_2.5.1                  generics_0.1.2            DelayedArray_0.16.3       DBI_1.1.2
 [89] pillar_1.7.0              withr_2.5.0               survival_3.3-1            abind_1.4-5
 [93] RCurl_1.98-1.6            ash_1.0-15                tibble_3.1.6              crayon_1.5.1
 [97] car_3.0-12                KernSmooth_2.23-20        utf8_1.2.2                BiocFileCache_1.14.0
[101] tzdb_0.3.0                progress_1.2.2            locfit_1.5-9.4            grid_4.0.4
[105] blob_1.2.3                digest_0.6.29             xtable_1.8-4              numDeriv_2016.8-1.1
[109] munsell_0.5.0             beeswarm_0.4.0            vipor_0.4.5


