By default, results of a GSEA run (= content of ego, below) are ranked on p-value, and, if these are tied, on NES. This (combined) ranking is used when selecting the number of top regulated gene sets to plot by using the argument showCategory. Also note that GSEA results are of class gseaResult.
For ordering the results in the dotplot and ridgeplot, you will need to set the argument orderBy.
Checking ?dotplot shows that for object with signature gseaResult it is explicitly stated that by default orderBy = "x". Since this is not very informative, the next question is: what is "x"? If you generate a dotplot you will see in it that it is the GeneRatio. This can also be seen in the source code of dotplot.
However, for the ridgeplot (?ridgeplot) the argument orderBy is not specified on the help page (but it is part of the ..., which in R has to be read as 'additional arguments to pass to a function'). Plotting a ridgeplot using default values is not very informative to find out which values are used for ordering. Yet, when checking the source code of the function, it shows that for ridgeplot the default setting is orderBy = "NES".
Thus: by default the order of the results in both plots is indeed not the same.
If you would like to have the same order, you should thus specify the argument orderBy. See code below for an example.
I also noticed that with dotplot you used the argument split=".sign". In the current version of enrichplot you should rather call the function facet_grid as well:
Thus: dotplot(ego, showCategory=10, split=".sign") + facet_grid(.~.sign)
I agree that this is not well documented. Also note that the ridgeplot can not be split.
Lastly, if you only would like to show some specific gene sets (GO categories in this case), for dotplot (and many other visualization functions) you can use the argument showCategory for this. You will need to specify a character vector with the description of the GO categories, not the id! See the 'Biomedical knowledge mining book' here for more info.
Note that for ridgeplot plotting specific gene sets is not possible (yet?), but it happened that someone just filed a request for this functionality on the Github page of enrichplot (here).
HTH!
> library(clusterProfiler)
> library(org.Hs.eg.db)
> data(geneList, package="DOSE")
>
> set.seed(22) # for reproducibility
>
> # generate some results
> ego <- gseGO(geneList = geneList,
+ OrgDb = org.Hs.eg.db,
+ ont = "BP",
+ minGSSize = 100,
+ maxGSSize = 500,
+ eps = 0,
+ pAdjustMethod = "BH",
+ pvalueCutoff = 0.05,
+ verbose = FALSE)
>
> # default plot (see title x-axis in dotplot)
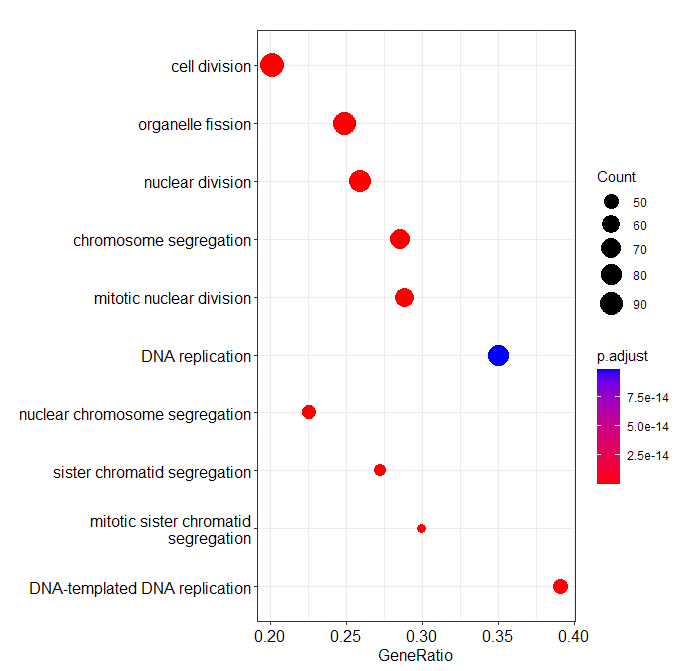
> dotplot(ego)
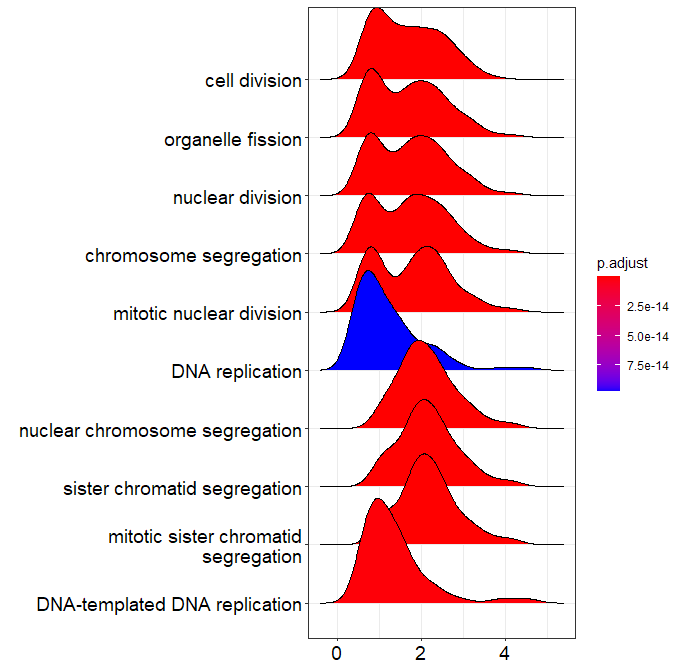
> ridgeplot(ego)
Picking joint bandwidth of 0.278
>
> # plots with identical order of categories, based on e.g. setSize.
> dotplot(ego, showCategory=10, orderBy = "setSize")
>
> ridgeplot(ego, showCategory=10, orderBy = "setSize")
Picking joint bandwidth of 0.28
>
> # facet dotplot
> library(ggplot2)
> dotplot(ego, showCategory=10, orderBy = "setSize", split=".sign") + facet_grid(.~.sign)
>
> # show only 8 randomly selected gene sets.
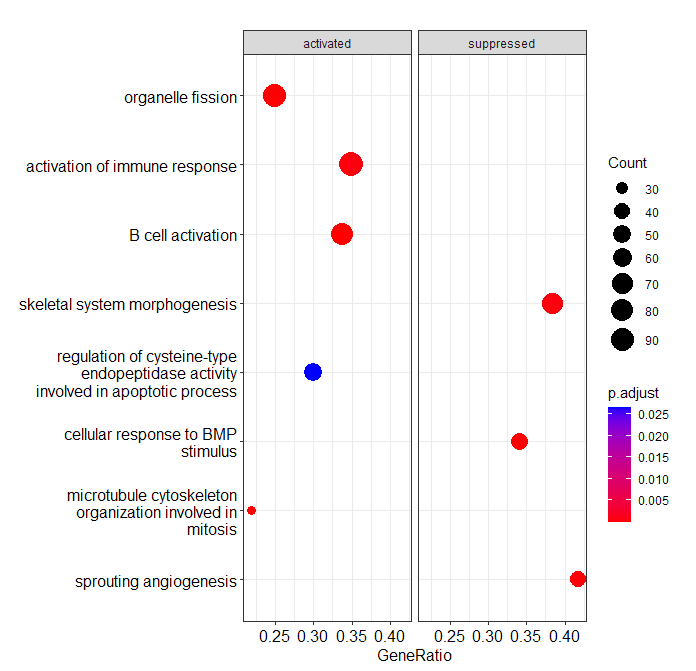
> GOcats4vis <- data.frame(ego)$Description[ sample(1:dim(data.frame(ego))[1], size = 8) ]
> GOcats4vis
[1] "sprouting angiogenesis"
[2] "microtubule cytoskeleton organization involved in mitosis"
[3] "B cell activation"
[4] "cellular response to BMP stimulus"
[5] "organelle fission"
[6] "activation of immune response"
[7] "skeletal system morphogenesis"
[8] "regulation of cysteine-type endopeptidase activity involved in apoptotic process"
>
> dotplot(ego, showCategory=GOcats4vis, orderBy = "setSize")
> dotplot(ego, showCategory=GOcats4vis, orderBy = "setSize", split=".sign") + facet_grid(.~.sign)
>
>
dotplot and ridgeplot displaying same order of gene sets:
dotplot:
ridgeplot:
split dotplot, orderBy=setSize with only the 8 randomly selected gene sets.
> sessionInfo()
R version 4.2.0 Patched (2022-05-12 r82348 ucrt)
Platform: x86_64-w64-mingw32/x64 (64-bit)
Running under: Windows 10 x64 (build 19042)

other attached packages:
[1] ggplot2_3.3.6         org.Hs.eg.db_3.15.0   AnnotationDbi_1.58.0
[4] IRanges_2.30.1        S4Vectors_0.34.0      Biobase_2.56.0
[7] BiocGenerics_0.42.0   clusterProfiler_4.4.4


Thanks Guido, that was extremely helpful. I just want to expand on ordering when you have a large number of results. Both
ridgeplot()anddotplot()will first filter by pvalue, depending on the number ofshowCategoryresults you set. As in, if you have 50 results in your gsea object, and setshowCategory = 20,ridgeplot()will first filter by raw pvalue for the top 20, and THEN order by the criteria set inorderBy(NES by default).Great tools, but I agree, this part was not well documented. It would also be helpful if you could order
ridgeplot()by gene descriptions in theshowCategoryparameter.