Hi all,
I'm currently in a bit of a pickle with my DESeq2 analysis.
Some information about the work: I have isolated a particular cell type from postmortem brain tissue from two experimental groups - cases and controls (n=25, n=24, respectively), which were sequenced with the intention of identifying DEGs between cases and controls. For those who aren't familiar, postmortem brain tissue is notorious for outliers - it may be the form of an outlier sample, but outlier genes (where the responsible sample always changes) is also typical and expected. This is neither pretty nor clean data to work with, but people work with it nonetheless.
PCA showed one outlier subject which was removed, however, outlier (extremely high) counts for genes here and there coming from different subjects each time is proving to be a problem for me. I understand that when there are no continuous variables/covariates included in the design formula, DESeq2 will perform outlier detection and replacement, which my dataset benefits greatly from.
However, it's also expected/typical for people doing similar postmortem brain work to control for continuous covariates including age, tissue pH, postmortem interval, and RINe. I have played around with adding some, all, or none of these variables to the design (all scaled and centred) and compared the different outputs. Regardless of the approach, the DEG output is atypically low (a handful of DEGs). Even with no continuous variables in the design, the output isn't exactly bountiful.
Some things I have tried based on other posts: Down-weighting genes with large Cook's distances (following script from here Applying replaceOutliers rather than throwing out genes when model includes continuous variable and DESeq2 - Replacing outliers with continuous variable in design. Given how much I've played around with the data and visualized select gene plots, I have a fairly good idea of which genes "should" show up as DEGs and adding weights just seems to hurt the outcome overall (I then get genes where most counts are zero but are driven by a couple of higher counts still below the Cook's cuts off).
What had the best outcome: Running DESeq2 in the absence of continuous variables in the design (just design = ~ Group). Extracting replaced counts matrix (that then resolves a number of outliers) and then re-feeding those counts into DESeq2 again, this time with continuous variables in the design. Is this kosher to do? I can say with some level of certainty that my outliers are not explained by the continuous variables I control for, postmortem tissue is simply weird.
I'm starting to think something is up, and I think it has something to do with frequent gene outliers, and Cook's cut off not always recognizing outliers.
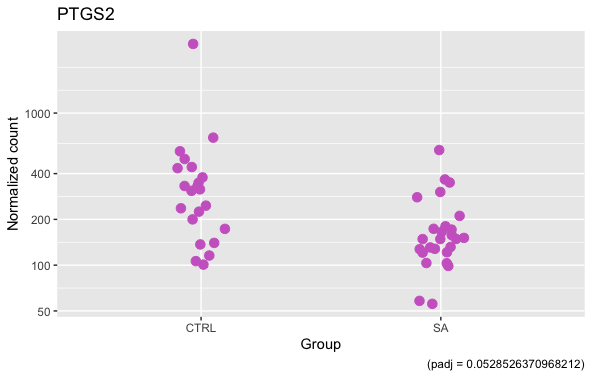
Take this DEG for e.g. https://docs.google.com/spreadsheets/d/1AEnSjo8bMxwiRQcJ-NI0QABpDhtkXE5I/edit?usp=sharing&ouid=118136492005618588020&rtpof=true&sd=true The count for s-173 was not flagged by DESeq2 (with design = ~ Group) and given a replaced count. How is this possible? And why is Cook's distance for S-173 so small?
Below is the plot for this DEG whose counts I shared, the outlier was not caught by Cook's
Another DEG, with and without what is obviously an outlier (this outlier is indeed caught by Cook's)
I'm worried that outliers are resulting in false positives and false negatives. What can I do here? Can I assign a unique Cook's cut off per gene? Can I just input the replaced counts and control for the variables I should control for? Is there a package I can use upstream to DESeq2 that performs refinement of outlier counts?
Thank you in advance!!!!
# now make this a factor as it will be the variable we will use define groups for the differential expression analysis
colData$Group <- factor(colData$Group, levels=c("CTRL", "SA"))

# scale age
ScaledAge = scale(colData$Age, center = TRUE, scale = TRUE)
colData$ScaledAge = ScaledAge

# scale PMI
ScaledPMI = scale(colData$PMI, center = TRUE, scale = TRUE)
colData$ScaledPMI = ScaledPMI

# scale RINe
ScaledRINe = scale(colData$RINe, center = TRUE, scale = TRUE)
colData$ScaledRINe = ScaledRINe

# scale pH
ScaledpH = scale(colData$pH, center = TRUE, scale = TRUE)
colData$ScaledpH = ScaledpH

# Lets create the DESeqDataSet object
dds <- DESeqDataSetFromMatrix(countData = round(cts),
                              colData = colData,
                              design = ~ ScaledAge + ScaledPMI + ScaledRINe + ScaledpH + Group)

# drop genes with less than 100 reads across all samples
keep <- rowSums(counts(dds)) >= 100
dds <- dds[keep,]

# run the DEseq2 analysis
dds <- DESeq(dds)

# get results for DEG analysis (and order by Pval) by specifying design
res <- results(dds,
               name = "Group_SA_vs_CTRL",
               alpha = 0.1)

# trying to weight-down genes with high Cook's distance
# accessing Cook's distances in matrix
cooks <- assays(dds)[["cooks"]]

# adding weights to genes with high Cook's Distance
assay(dds, "weights", withDimnames = FALSE) <- matrix(1, nrow(dds), ncol(dds)) # set all weights to 1 at first
assays(dds)[["weights"]][cooks > 10] <- 1e-1 # you'd have to pick a good cutoff for your data

# re-run DESeq2
design(dds) <- ~ ScaledAge + ScaledPMI + ScaledRINe + ScaledpH + Group
dds <- DESeq(dds)
res <- results(dds,
               name = "Group_SA_vs_CTRL",
               alpha = 0.1)


Hi Michael, thank you for such a fast response! And thank you for the obvious (the package itself, and a sparkling clear vignette for noobs like myself who are simultaneously learning DEG analysis and R at the same time).
When using the down-weighting script, I found that I lost some DEGs that, by eye, certainly looked like DEGs. This was the case when setting
[cooks > 10] <- 1e-1, as I show in my script.As you suggested, I applied
keep <- rowSums(counts(dds) >= 10) >= Xto remove "genes where most counts are zero" and it absolutely remedied that problem, however, in combination with down-weighting, my DEGs list dropped from 30 to 17.I also just tried the last thing I had on my "to try" list and that was to discretize my continuous variables and include those in the design. As of now, the best outcome out of everything I have tried is discretizing the variable I know (through previous sensitivity analyses) has the biggest impact on the data - tissue pH. Adding into the design 5 bins for tissue pH has given me 40 DEGs - all genes with consistently higher counts, all look like DEGs to the eye.
I guess the reality is that the phenotype (within the single cell type) I'm studying has more subtle changes. I can see many genes that don't pass multiple testing. Have you come across datasets that don't yield much?
Thanks again!
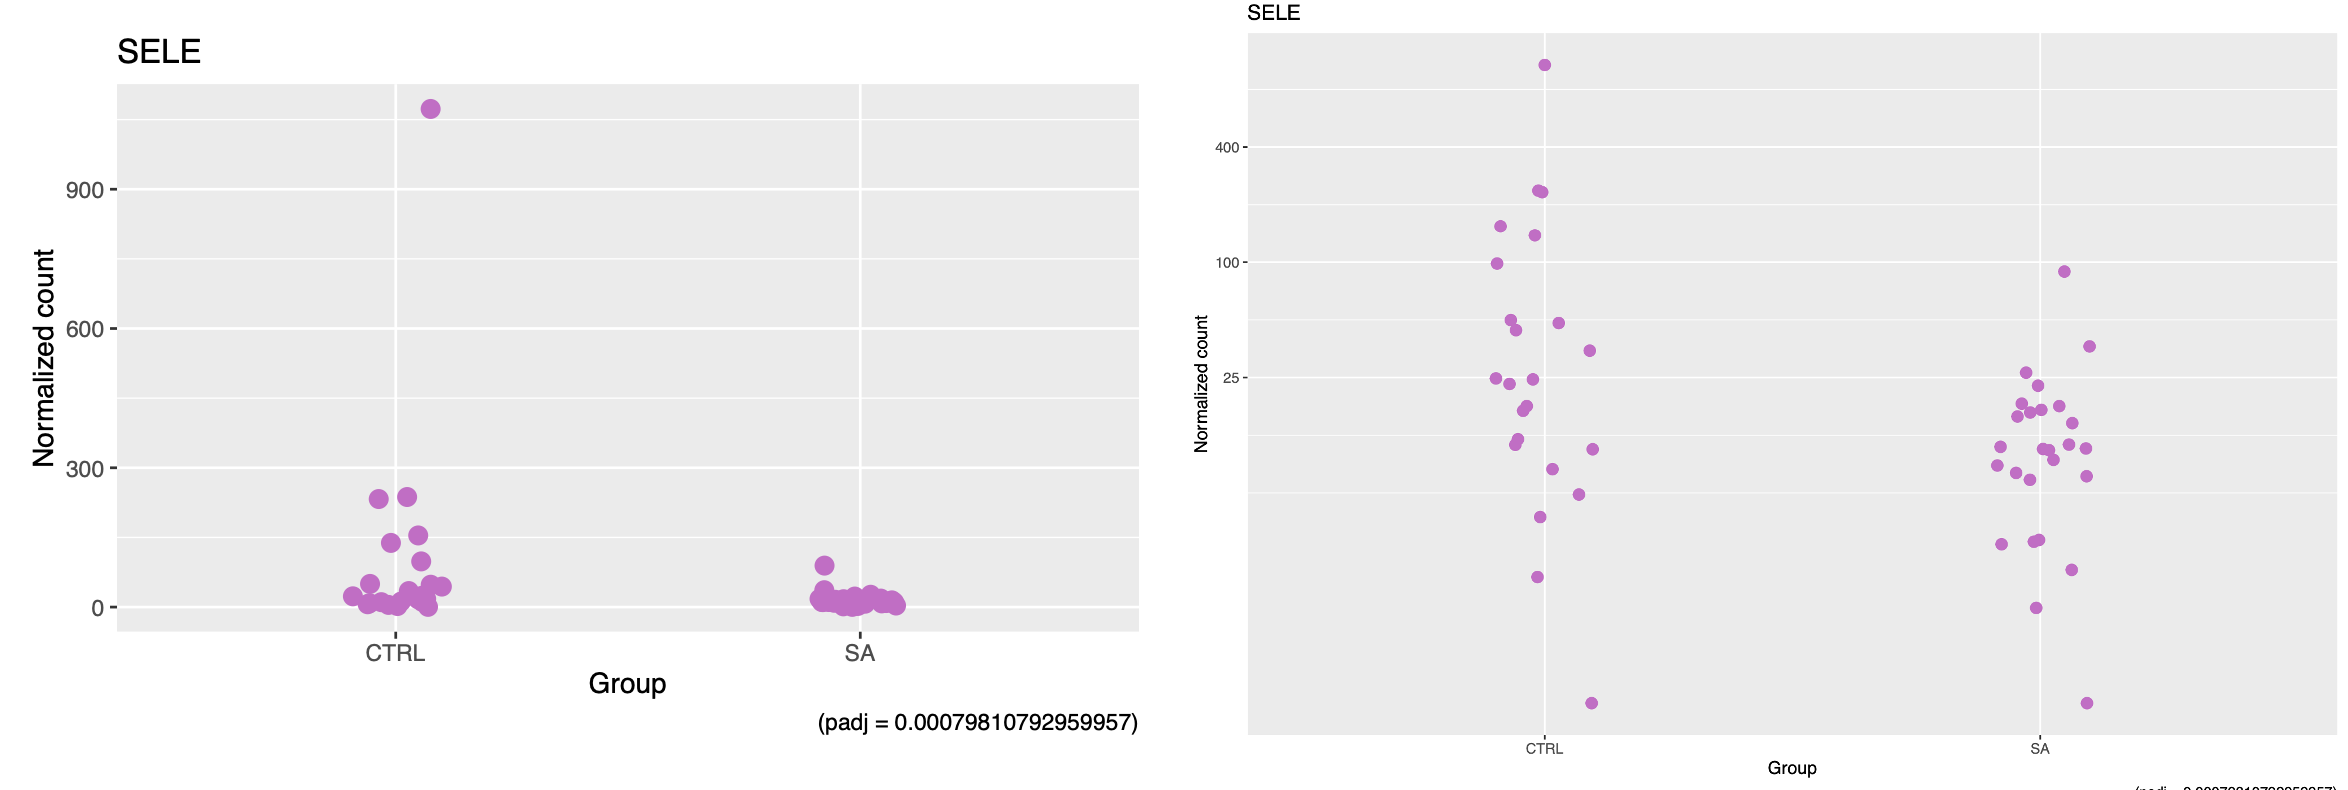
However, now the gene SELE (plot above) has clear outliers not picked up by DESeq
https://docs.google.com/spreadsheets/d/1hNLUarSg_D3TWNr6aZ_YyJKWgyY3U7Ij/edit?usp=sharing&ouid=118136492005618588020&rtpof=true&sd=true
This gene has dispersion outliers, presumably both points at 1000 and +2250. In your opinion, what should I do with this DEG? I presume dispersion outliers affect the pvalue?
What are the Cook's values for these samples?
I managed to resolve a lot of issues I was having use the sva package, which changed my results significantly! Thank you for your help regardless!!