Hello all, I am currently performing analysis in R to find whether there are differentially expressed genes between samples with cancer, and without cancer (benign), as a student project. I am using the HuProt array, and thus have around 48,000 observations per sample. Before using limma, I used t.tests to see whether there were any significant genes. This is how I've done the t.tests:
p.val <- c()
for(i in 1:length(total_635[,1])){
  p.val[i] <- t.test(total_635[i,c(4:22)],total_635[i,c(23:40)])$p.val
}
Each row corresponds to a gene, and columns 4:22 represent the log2-transformed, normalised (normalised between arrays) intensities for the benign samples, and the columns 23:40 represent the log2-transformed, normalised intensities for the cancer samples.
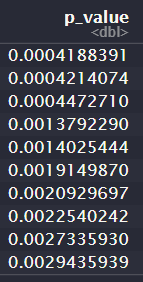
This is the output:
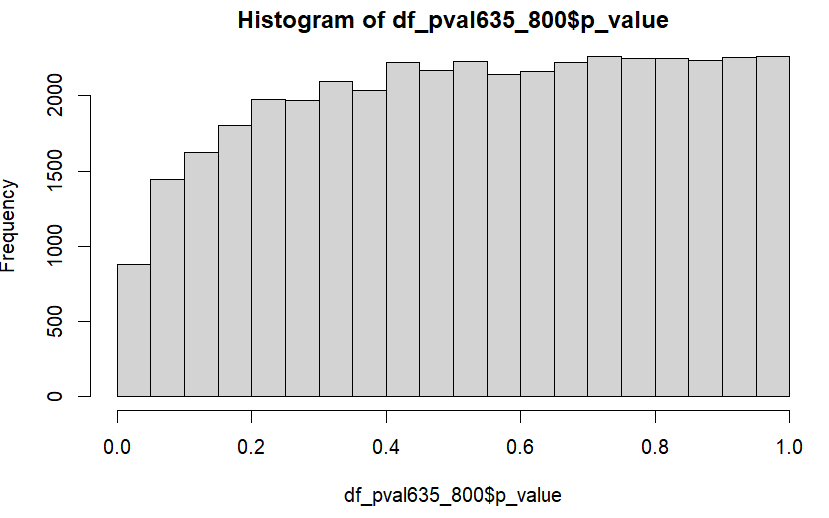
This is a histogram of the p-values:
I then adjusted the p-values using this method:
df_pval635_800$p_value_adj <- p.adjust(df_pval635_800$p_value, "fdr")
This is a summary of the adjusted p-value column:
I'm not sure why there are no significant adjusted p-values, plus the distribution of the unadjusted p-values seems slightly off! Is there any reason why this may be so?
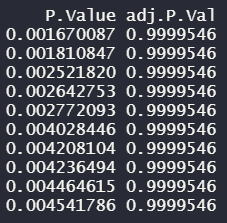
These are the p-values and adjusted p-values after conducting lmFit():
This is the design matrix used, etc.:
Group <- factor(targets$Type, levels=c("Benign","Cancer"))
design <- model.matrix(~0+Group)
colnames(design) <- c("Benign", "Cancer")
total_635sorted <- total_635[order(total_635$ID), ]

total_635n <- total_635sorted[,-c(1,2,3)] #removing Name column, ID column, etc.
correlation <- duplicateCorrelation(total_635n, design, ndups=2, spacing=1)
correlation <- correlation$consensus.correlation

fit <- lmFit(total_635n, design, correlation=correlation, ndups=2, spacing=1)
cont.matrix <- makeContrasts(Cancer-Benign, levels=design)
fit <- contrasts.fit(fit, cont.matrix)
lmfit_800_635 <- eBayes(fit)
Limma doesn't seem to identify any significant adjust p-values either. I'm not sure if this is representative of the data. Any advice would be greatly appreciated!
Thank you.


