
Hello:
Dose anyone have experiences in using DiffBind for spike-in normalization? I have dm6 spike-in for both input and IP samples. I have aligned bam files for each sample with both human and drosophila genomes, i.e, each sample has four bam files: two input bam files for hg19 and dm6, and two IP bam file for hg19 and dm6 (see below) . In the example of user guild of DiffBind, there is only one spike-in for each sample in column Spikein in the sample-sheet. How can I use the spikein for both input and IP samples? Or can you give me suggestions to how to set up the sample-sheet?
bam_files:
C1_IP_hg19.bam, C1_IP_dm6.bam, C1_input_hg19.bam, C1_input_dm6.bam,
C2_IP_hg19.bam, C2_IP_dm6.bam, C2_input_hg19.bam, C2_input_dm6.bam,
C3_IP_hg19.bam, C3_IP_dm6.bam, C3_input_hg19.bam, C3_input_dm6.bam,
T1_IP_hg19.bam, T1_IP_dm6.bam, T1_input_hg19.bam, T1_input_dm6.bam,
T2_IP_hg19.bam, T2_IP_dm6.bam, T2_input_hg19.bam, T2_input_dm6.bam,
T3_IP_hg19.bam, T3_IP_dm6.bam, T3_input_hg19.bam, T3_input_dm6.bam
C is control and T is treatment.
Thanks

Hello Rory,
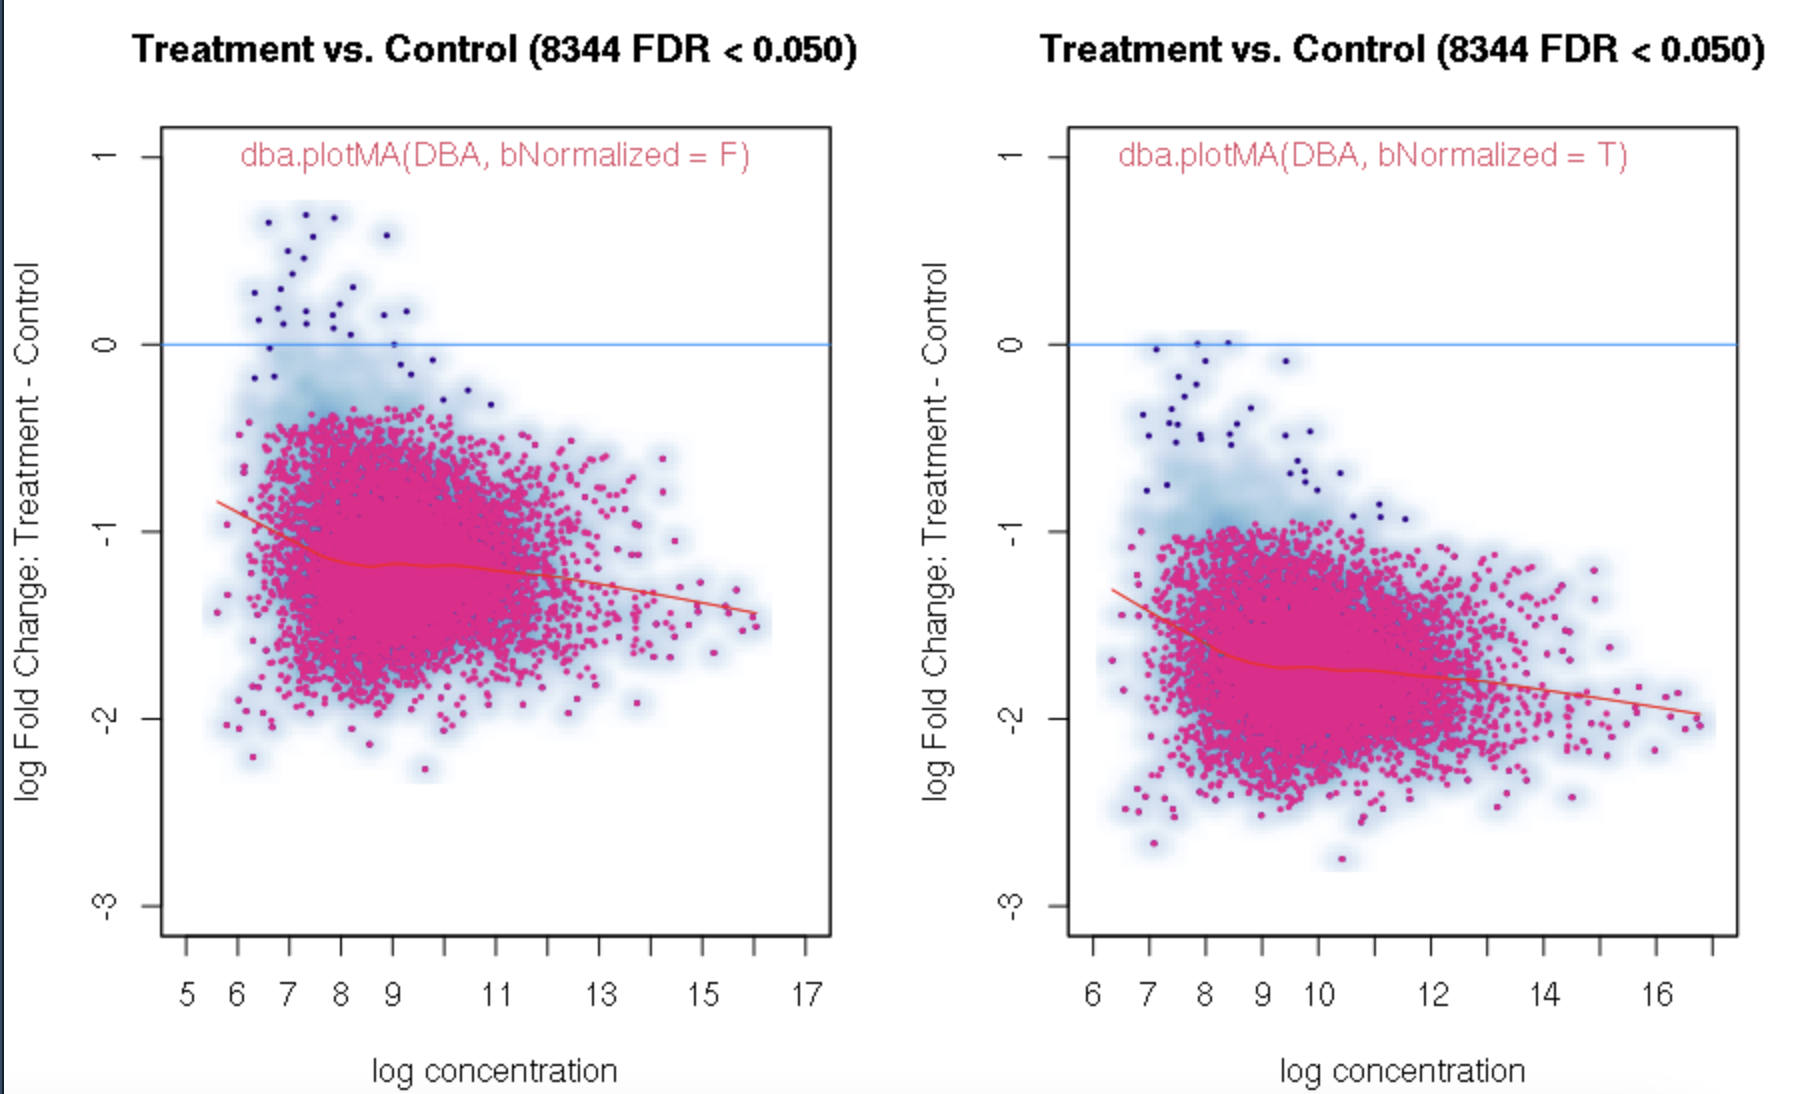
I found a bug in DiffBind3. The parameter "fold" in dba.report and dba.plotVolcano will filter out negative values (see example below). I tested DiffBind 3.4.11 and 3.6.5. The bug exists in both versions.
When I checked the results, all the regions have Fold < 0. So I think the threshold fold = 1 will filter out all negative fold values, and it should be abs(log2(fold)) >=1. Did you forget to use abs() in your scripts?
The
foldparameter does respectabs(). You can see this with the example dataset:It is important to note that when you specify a
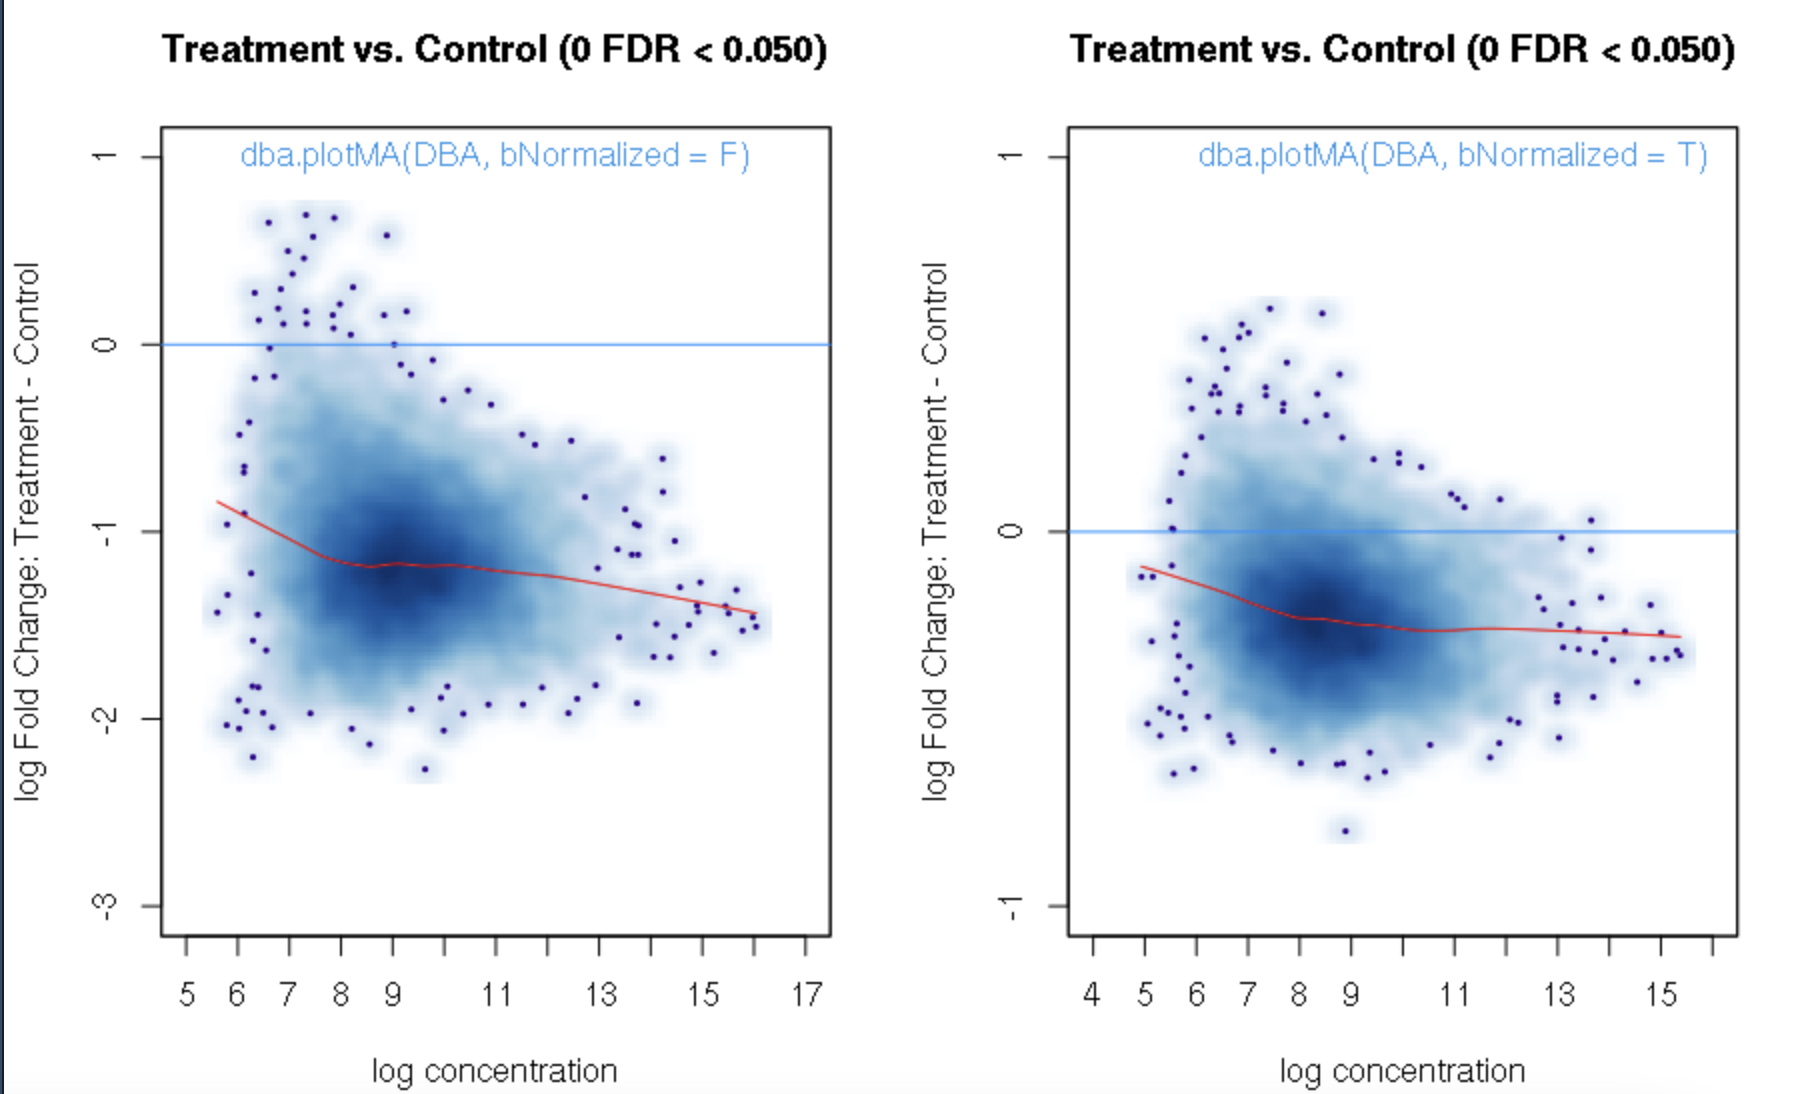
foldvalue for the report, all the confidence statistics are recalculated. This is because the request is interpreted as changing the null hypothesis from a basis offold=0tofold=1. In the above example, you can see that in the default report, there were 772 sites with a FDR < 0.05 that have an absolute log fold change greater than 1, while in the report wherefold=1is specified, there are only 189 sites that still have FDR < 0.05.You may want to try the
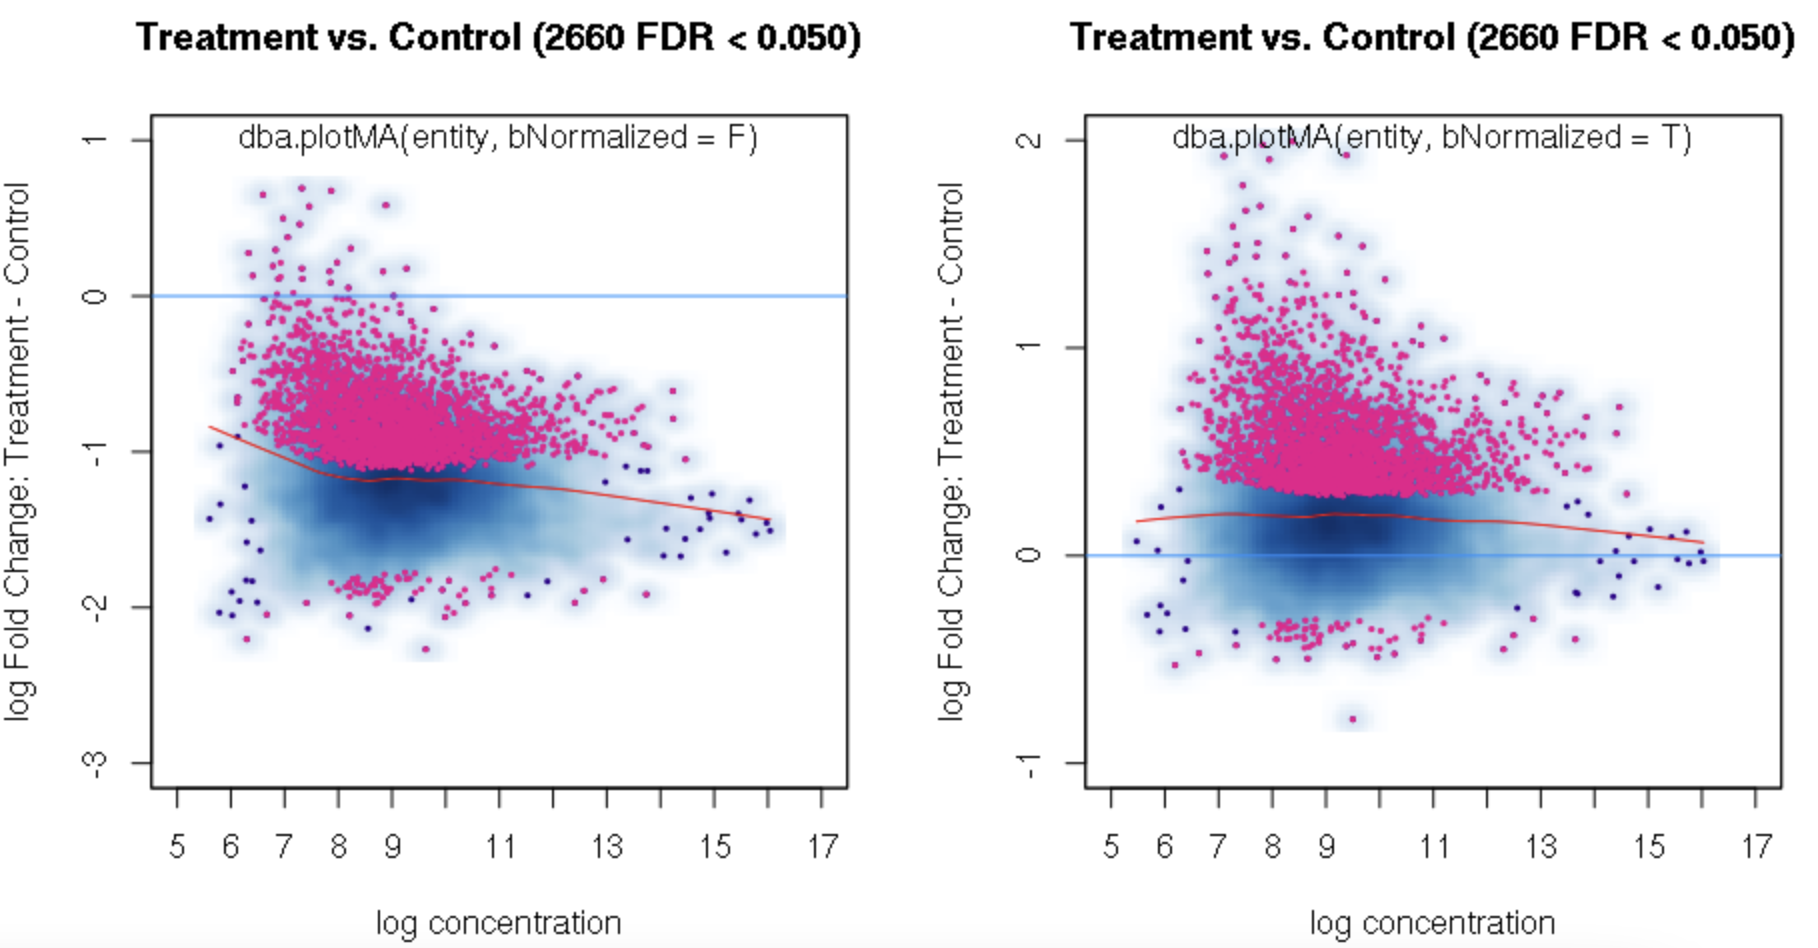
fold=1report withth=1to retrieve all the sites and see how the FDR calculations have changed.Thank you. Yes, you are right. FDR calculations have changed when I set fold=1 report with th=1. It is a little strange for me that the FDR dependents on threshold of fold. For our datasets, all the fold values are negative and the signals are very strong when checked in IGV. But when I set fold = 1, there were no sites with FDR < 0.05. For me, FDR should be a global setting and does not depend on fold settings.
The idea is that when you are looking to identify changes above a certain fold threshold, you have changed the null hypothesis from "no change" to "no change greater than fold", which requires a more stringent computation of FDR values.
You can isolate the sites with greater fold changes using the "no change" null pretty easily:
Yes, I have used these codes to filter the results and got quite good results. I think we should warn the users for this special settings. Maybe someone else may encounter the same issues. For most of the users, DiffBind is a good software but a little complex to use.
Thank you very much!
I do find a paper that uses spike-in for both IP and Input: https://pubmed.ncbi.nlm.nih.gov/29107533/
This method would be straightforward to add to
DiffBind, I'll add it to the feature request list.