
Hello!
This is my first attempt to do DESeq2 analysis. I followed the vignettes and tutorials I could find online as best, but got unexpectedly low number of DE genes. In the experiment, there are 2 subjects (X90 and X92) and 2 paired samples from each (Tom=control and Venus=treated). The counts were obtained using salmon, and for the DESeq2 analysis (DESeq2_1.36.0) I have used the salmon.merged.gene_counts_length_scaled.tsv, as recommended.
salmon_table<-read.table("results/star_salmon/salmon.merged.gene_counts_length_scaled.tsv",
sep="\t",header=TRUE,row.names="gene_id")
cts <- salmon_table[,c(2:5)] # sub-setting to exclude a subject with problematic sequencing quality
cts <- as.matrix(round(cts))
coldata<-read.csv("metadata.csv",header=TRUE,row.names=1)
coldata<-coldata[1:4,] # sub-setting to exclude a subject with problematic sequencing quality
dds<- DESeqDataSetFromMatrix(countData = cts,
colData = coldata,
design= ~ mouse+genotype)
dds <- dds[ rowSums(counts(dds)) > 1, ]
vsd<-vst(dds, blind=TRUE)
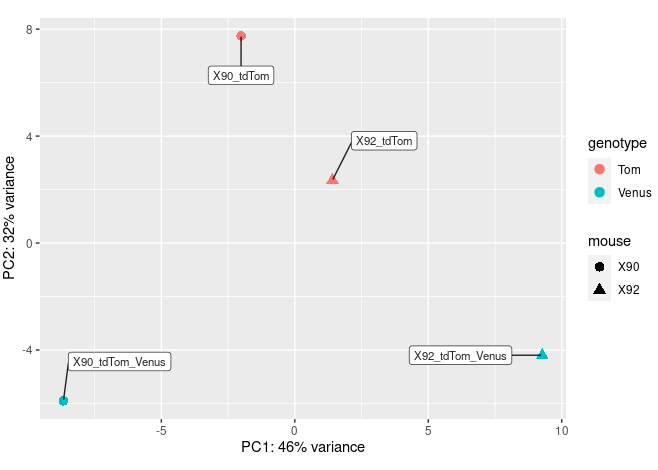
pcaData <- plotPCA(vsd, intgroup=c("mouse","genotype"), returnData=TRUE)
percentVar <- round(100 * attr(pcaData, "percentVar"))
ggplot(pcaData, aes(PC1, PC2, color=genotype, shape=mouse)) +
geom_point(size=3) +
xlab(paste0("PC1: ",percentVar[1],"% variance")) +
ylab(paste0("PC2: ",percentVar[2],"% variance")) +
coord_fixed() +
geom_label_repel(aes(label = name), colour = I(alpha("black", 0.85)),
size = 3,box.padding = 1.5,fill="white",max.overlaps = 30 );
dds<-DESeq(dds)

res_genotype_Venus_vs_Tom_noshrink<- results(dds, contrast=c("genotype","Venus","Tom"), independentFiltering=TRUE)

summary(res_genotype_Venus_vs_Tom_noshrink)
out of 30674 with nonzero total read count
adjusted p-value < 0.1
LFC > 0 (up)       : 12, 0.039%
LFC < 0 (down)     : 57, 0.19%
outliers [1]       : 0, 0%
low counts [2]     : 16057, 52%
(mean count < 20)
[1] see 'cooksCutoff' argument of ?results
[2] see 'independentFiltering' argument of ?results
About half (52%) of the genes were filtered due to low counts (<20). Looking at the MA plot, it appears that there are some genes high-ish log2FC exhibiting such average counts.
plot(log2(res_genotype_Venus_vs_Tom_noshrink$baseMean),
     res_genotype_Venus_vs_Tom_noshrink$log2FoldChange)
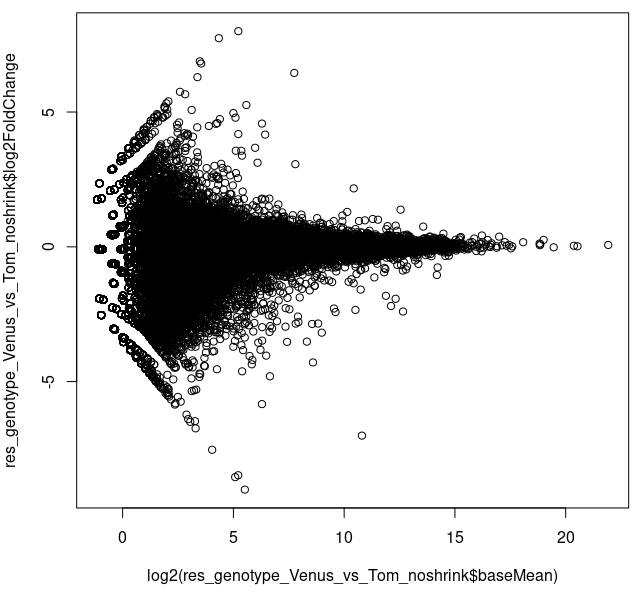
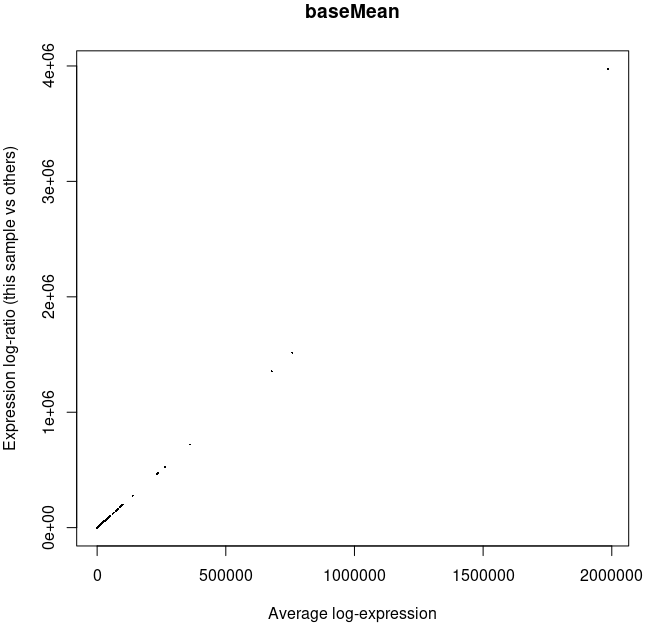
I had to plot it as above, since the default plotting command plotMA() produced
plotMA(res_genotype_Venus_vs_Tom_noshrink)
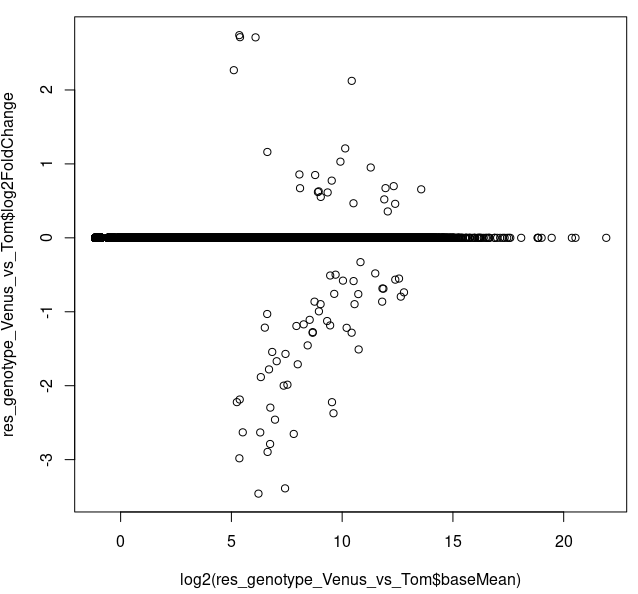
I also performed shrinking and it looks like the genes with < 2^^5 = 32 counts have shrunk log2FC set to ~0 (which, from what I read online can be due to either "low counts" or "high dispersion")
res_genotype_Venus_vs_Tom <- lfcShrink(dds, coef="genotype_Venus_vs_Tom",
   type="apeglm",res=res_genotype_Venus_vs_Tom_noshrink)

plot(log2(res_genotype_Venus_vs_Tom$baseMean),
  res_genotype_Venus_vs_Tom$log2FoldChange)
My questions are: am I doing something wrong? Am I missing some DE genes from the mean count < 20 region? And how DESeq2 arrived at the cut-off value of 20?
Thank you in advance for any insight/suggestions!
sessionInfo( )
R version 4.2.0 (2022-04-22)
Platform: x86_64-pc-linux-gnu (64-bit)
Running under: Scientific Linux 7.5 (Nitrogen)

Matrix products: default
BLAS:   /exports/eddie3_apps_local/apps/community/roslin/R/4.2.0/lib64/R/lib/libRblas.so
LAPACK: /exports/eddie3_apps_local/apps/community/roslin/R/4.2.0/lib64/R/lib/libRlapack.so

locale:
 [1] LC_CTYPE=en_GB.UTF-8       LC_NUMERIC=C
 [3] LC_TIME=en_GB.UTF-8        LC_COLLATE=en_GB.UTF-8
 [5] LC_MONETARY=en_GB.UTF-8    LC_MESSAGES=en_GB.UTF-8
 [7] LC_PAPER=en_GB.UTF-8       LC_NAME=C
 [9] LC_ADDRESS=C               LC_TELEPHONE=C
[11] LC_MEASUREMENT=en_GB.UTF-8 LC_IDENTIFICATION=C

attached base packages:
[1] stats4    stats     graphics  grDevices utils     datasets  methods
[8] base

other attached packages:
 [1] apeglm_1.18.0               PCAtools_2.8.0
 [3] tximport_1.24.0             readr_2.1.3
 [5] tzdb_0.3.0                  RColorBrewer_1.1-3
 [7] edgeR_3.38.4                limma_3.52.4
 [9] patchwork_1.1.2             viridis_0.6.2
[11] viridisLite_0.4.0           EnhancedVolcano_1.14.0
[13] ggrepel_0.9.1               cowplot_1.1.1
[15] org.Mm.eg.db_3.15.0         AnnotationDbi_1.58.0
[17] DOSE_3.22.1                 clusterProfiler_4.4.4
[19] pheatmap_1.0.12             ggplot2_3.3.6
[21] DESeq2_1.36.0               memoise_2.0.1
[23] SummarizedExperiment_1.26.1 Biobase_2.56.0
[25] MatrixGenerics_1.8.1        matrixStats_0.62.0
[27] GenomicRanges_1.48.0        GenomeInfoDb_1.32.4
[29] IRanges_2.30.0              S4Vectors_0.34.0
[31] BiocGenerics_0.42.0         Matrix_1.5-1

loaded via a namespace (and not attached):
  [1] shadowtext_0.1.2          fastmatch_1.1-3
  [3] plyr_1.8.7                igraph_1.3.5
  [5] lazyeval_0.2.2            splines_4.2.0
  [7] BiocParallel_1.30.3       digest_0.6.29
  [9] yulab.utils_0.0.5         GOSemSim_2.22.0
 [11] GO.db_3.15.0              fansi_1.0.3
 [13] magrittr_2.0.3            ScaledMatrix_1.4.1
 [15] Biostrings_2.64.1         annotate_1.74.0
 [17] graphlayouts_0.8.2        bdsmatrix_1.3-6
 [19] enrichplot_1.16.2         colorspace_2.0-3
 [21] blob_1.2.3                dplyr_1.0.10
 [23] crayon_1.5.1              RCurl_1.98-1.9
 [25] jsonlite_1.8.2            scatterpie_0.1.8
 [27] genefilter_1.78.0         survival_3.3-1
 [29] ape_5.6-2                 glue_1.6.2
 [31] polyclip_1.10-0           gtable_0.3.0
 [33] zlibbioc_1.42.0           XVector_0.36.0
 [35] DelayedArray_0.22.0       BiocSingular_1.12.0
 [37] scales_1.2.0              mvtnorm_1.1-3
 [39] DBI_1.1.3                 Rcpp_1.0.9
 [41] emdbook_1.3.12            xtable_1.8-4
 [43] gridGraphics_0.5-1        tidytree_0.4.1
 [45] dqrng_0.3.0               bit_4.0.4
 [47] rsvd_1.0.5                httr_1.4.4
 [49] fgsea_1.22.0              ellipsis_0.3.2
 [51] pkgconfig_2.0.3           XML_3.99-0.11
 [53] farver_2.1.1              locfit_1.5-9.6
 [55] utf8_1.2.2                labeling_0.4.2
 [57] ggplotify_0.1.0           tidyselect_1.1.2
 [59] rlang_1.0.4               reshape2_1.4.4
 [61] munsell_0.5.0             tools_4.2.0
 [63] cachem_1.0.6              downloader_0.4
 [65] cli_3.3.0                 generics_0.1.3
 [67] RSQLite_2.2.18            stringr_1.4.0
 [69] fastmap_1.1.0             ggtree_3.4.4
 [71] bit64_4.0.5               tidygraph_1.2.2
 [73] purrr_0.3.5               KEGGREST_1.36.3
 [75] ggraph_2.0.6              nlme_3.1-158
 [77] sparseMatrixStats_1.8.0   aplot_0.1.7
 [79] DO.db_2.9                 compiler_4.2.0
 [81] png_0.1-7                 treeio_1.20.2
 [83] tibble_3.1.7              tweenr_2.0.2
 [85] geneplotter_1.74.0        stringi_1.7.8
 [87] lattice_0.20-45           vctrs_0.4.1
 [89] pillar_1.8.0              lifecycle_1.0.1
 [91] data.table_1.14.2         bitops_1.0-7
 [93] irlba_2.3.5.1             qvalue_2.28.0
 [95] R6_2.5.1                  gridExtra_2.3
 [97] codetools_0.2-18          MASS_7.3-58
 [99] withr_2.5.0               GenomeInfoDbData_1.2.8
[101] parallel_4.2.0            hms_1.1.2
[103] grid_4.2.0                ggfun_0.0.7
[105] beachmat_2.12.0           coda_0.19-4
[107] tidyr_1.2.1               DelayedMatrixStats_1.18.1
[109] bbmle_1.0.25              ggforce_0.4.1
[111] numDeriv_2016.8-1.1

Thanks, makes sense!