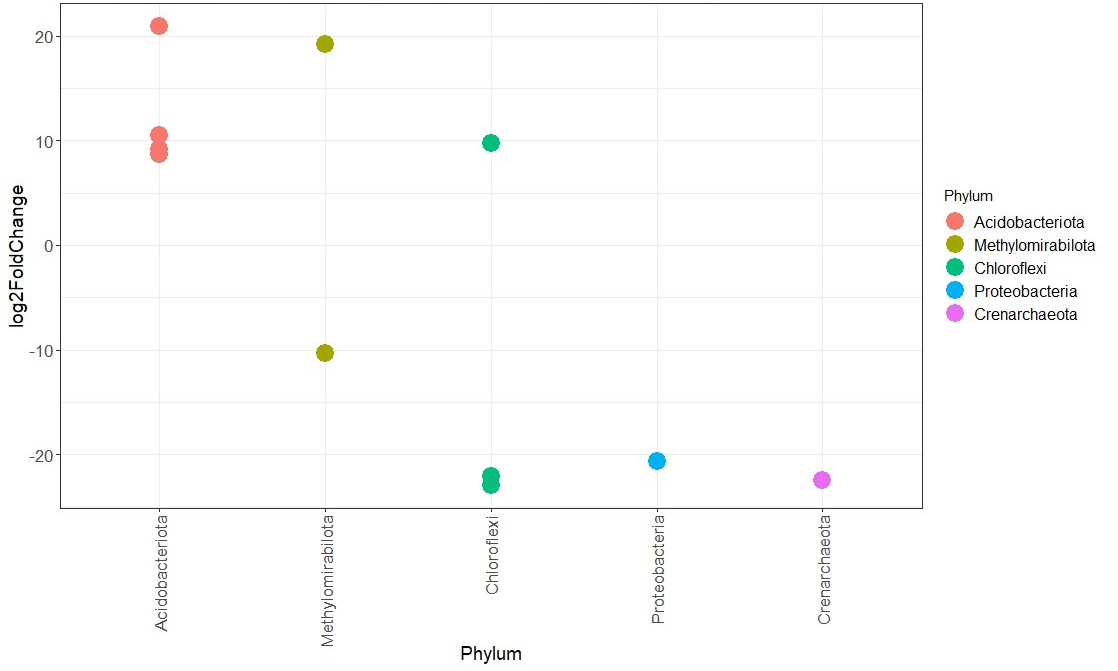
Hi everybody, I am working on a 16S dataset with 4 different groups (biodiversity gradient) and I successfully ran a deseq2 analysis for the phyloseq object (16S data) with this code:
diagdds = phyloseq_to_deseq2(phyloseq, ~ group)
diagdds = DESeq(diagdds, test="Wald", fitType="parametric")
res = results(diagdds, cooksCutoff = FALSE)
alpha = 0.01
sigtab = res[which(res$padj < alpha), ]
sigtab = cbind(as(sigtab, "data.frame"), as(tax_table(carbom)[rownames(sigtab), ], "matrix"))
head(sigtab)
dim(sigtab)

theme_set(theme_bw())
scale_fill_discrete <- function(palname = "Set1", ...) {
  scale_fill_brewer(palette = palname, ...)
}

x = tapply(sigtab$log2FoldChange, sigtab$Phylum, function(x) max(x))
x = sort(x, TRUE)
sigtab$Phylum = factor(as.character(sigtab$Phylum), levels=names(x))

ggplot(sigtab, aes(x=Phylum, y=log2FoldChange, color=Phylum)) + geom_point(size=6) +
  theme(axis.text.x = element_text(angle = -90, hjust = 0, vjust=0.5))
The image shows the result. Now my question: how can I extract the information out of the Deseq2 results in which of the biodiversity gradient (groups) the abundance of the phyla was low or high? So, Deseq2 gives the information, that these phyla are differently abundant between the 4 groups, but how do I know in which way? E.g. Proteobacteria: I need to know whether they occur rather in the highly biodiverse or in the low biodiverse group. I have searched quite a while but I didn’t come across any useful hint. Any help is appreciated, thank you!


