Entering edit mode
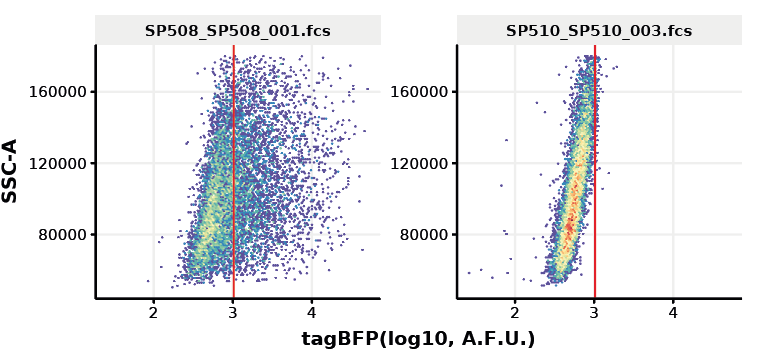
Hi everyone. Does anyone know how to add a legend for the color scale gradient used in ggcyto::autoplot plots like this? \ Thanks!
autoplot(plotdata,
         "BV421.A",
         "SSC.A",
         bins=128) +
  geom_gate(g1) +
  scale_x_continuous(
    name = "tagBFP(log10, A.F.U.)") +
  ggcyto_par_set(limits = list(x=c(1.5,5)))
sessionInfo( )


